prometheus
This post is one of a series of posts about monitoring of infrastructure and services. Other posts in the series:
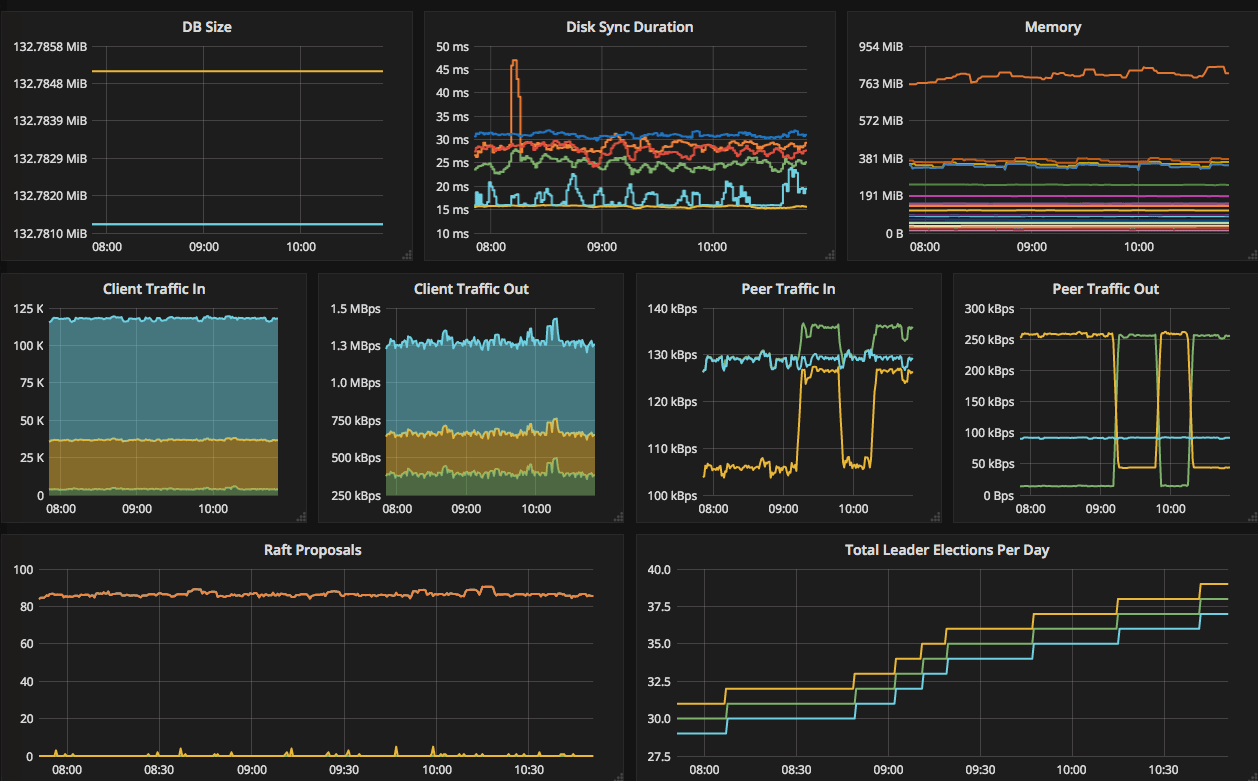
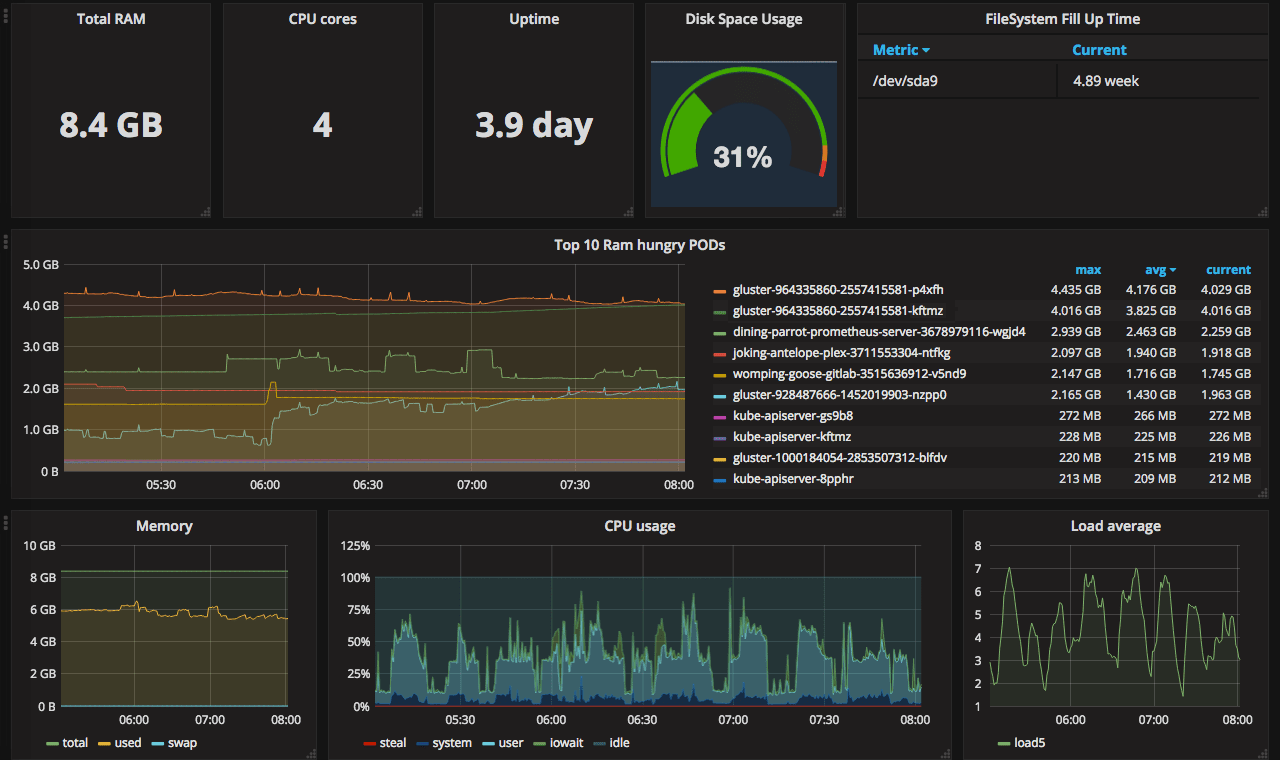
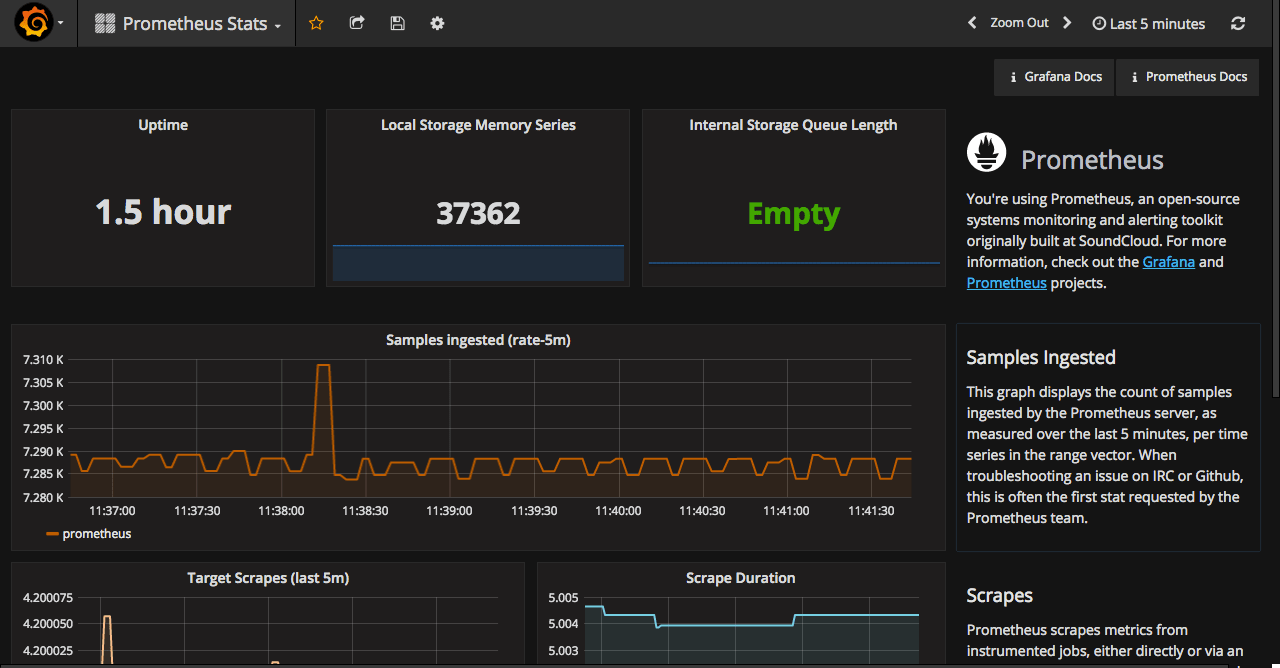
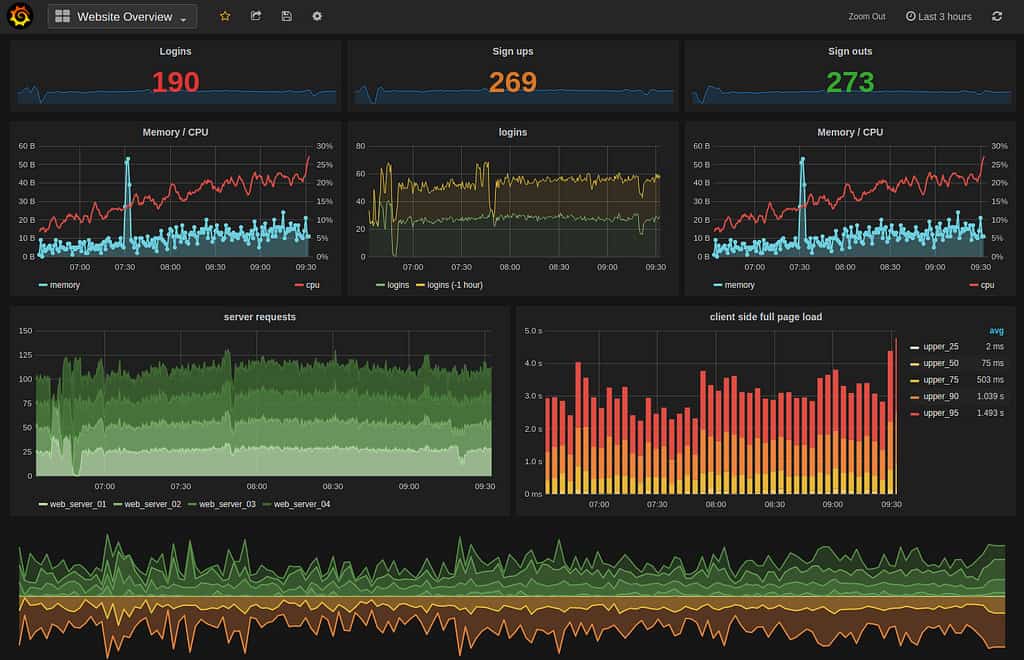
Intro Deploying Prometheus and Grafana to Kubernetes Creating the first dashboard in Grafana 10 most useful Grafana dashboards to monitor Kubernetes and services (this article) Configuring alerts in Prometheus and Grafana Collecting errors from production using Sentry Making sense of logs with ELK stack Replacing commercial APM monitoring SLA, SLO, SLI and other useful abstractions There are dozens of ready dashboards available on grafana.
This post is one of a series of posts about monitoring of infrastructure and services. Other posts in the series:
Intro Deploying Prometheus and Grafana to Kubernetes Creating the first dashboard in Grafana (this article) 10 most useful Grafana dashboards to monitor Kubernetes and services Configuring alerts in Prometheus and Grafana Collecting errors from production using Sentry Making sense of logs with ELK stack Replacing commercial APM monitoring SLA, SLO, SLI and other useful abstractions Having grafana.
This post is one of a series of posts about monitoring of infrastructure and services. Other posts in the series:
Intro Deploying Prometheus and Grafana to Kubernetes (this article) Creating the first dashboard in Grafana 10 most useful Grafana dashboards to monitor Kubernetes and services Configuring alerts in Prometheus and Grafana Collecting errors from production using Sentry Making sense of logs with ELK stack Replacing commercial APM monitoring SLA, SLO, SLI and other useful abstractions I’ve been keeping my eye on Prometheus for some time.
Intro (this article) Deploy and basic configuration of Prometheus Creating the first dashboard in Grafana 10 most useful Grafana dashboards to monitor Kubernetes and services Configuring alerts in Prometheus and Grafana Collecting errors from production using Sentry Making sense of logs with ELK stack Replacing commercial APM monitoring SLA, SLO, SLI and other useful abstractions Monitoring of the infrastructure is an essential part of any product. But it’s not uncommon for companies to postpone monitoring for the later period.
