How to deploy multi-arch Kubernetes cluster using Kubespray I recently bought 3 ODROID-HC1 devices to add a dedicated storage cluster to my home Kubernetes. I thought that it’s a good excuse to spend some time redeploying the cluster. Usually, I would’ve gone with CoreOS, since I’m a big fan of their immutable OS. Unfortunately, that is not an option if you have ARM nodes. So I had to choose between manual provisioning and Ansible.
infrastructure
Home Lab Infrastructure Overview
Overview of the infrastructure in my home lab
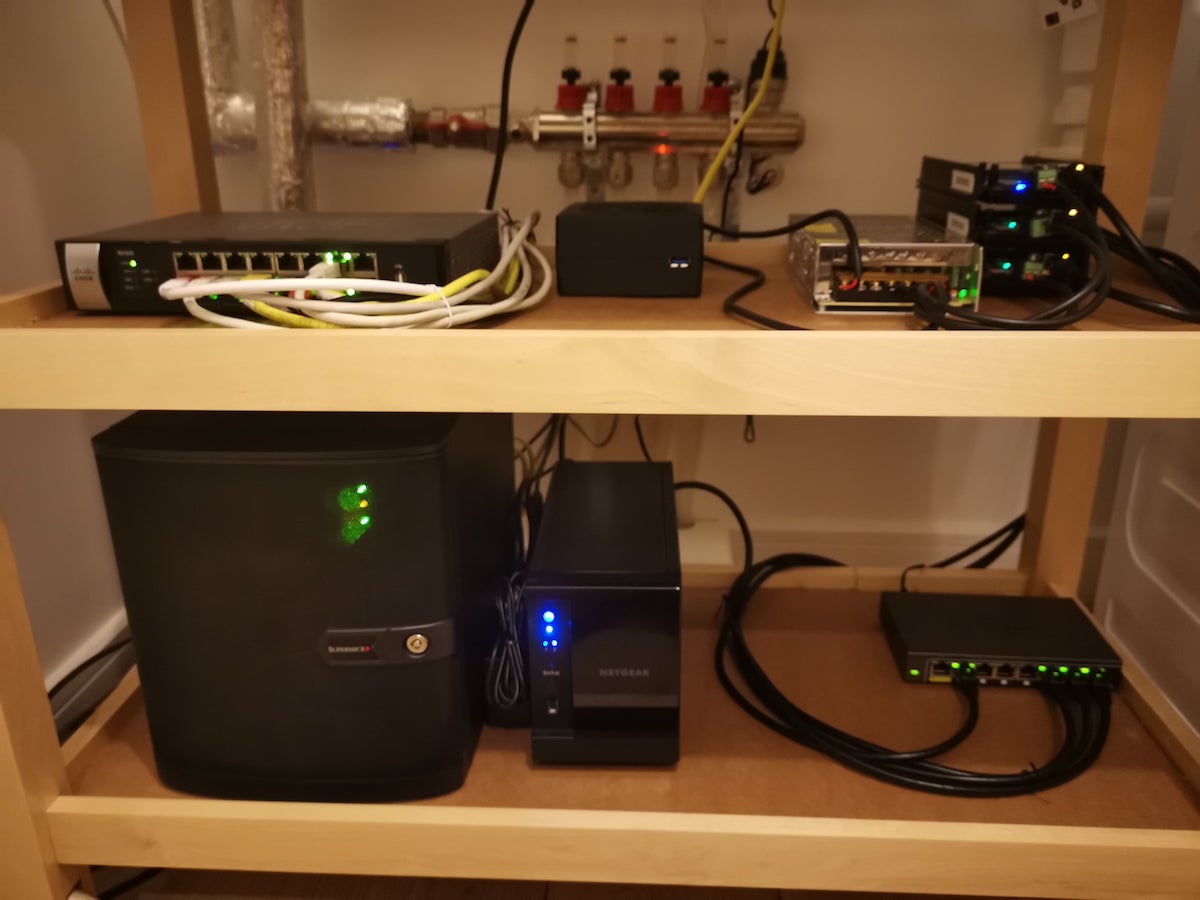
Home Lab Infrastructure Overview Every software or technology I blog about usually goes through my home lab first. A lot of people usually got surprised when they first hear that I have a multi-node Kubernetes cluster at home. It usually takes some time to tell them about all the machines and networking. Of course, not accounting for the time spent answering the question “why do you need it”. I added a few new devices and reconfigured everything from scratch recently.
Going open-source in monitoring, part V: Collecting errors from production using Sentry
Series of posts about migration from commercial monitoring systems to opensource. Replace NewRelic with Prometheus
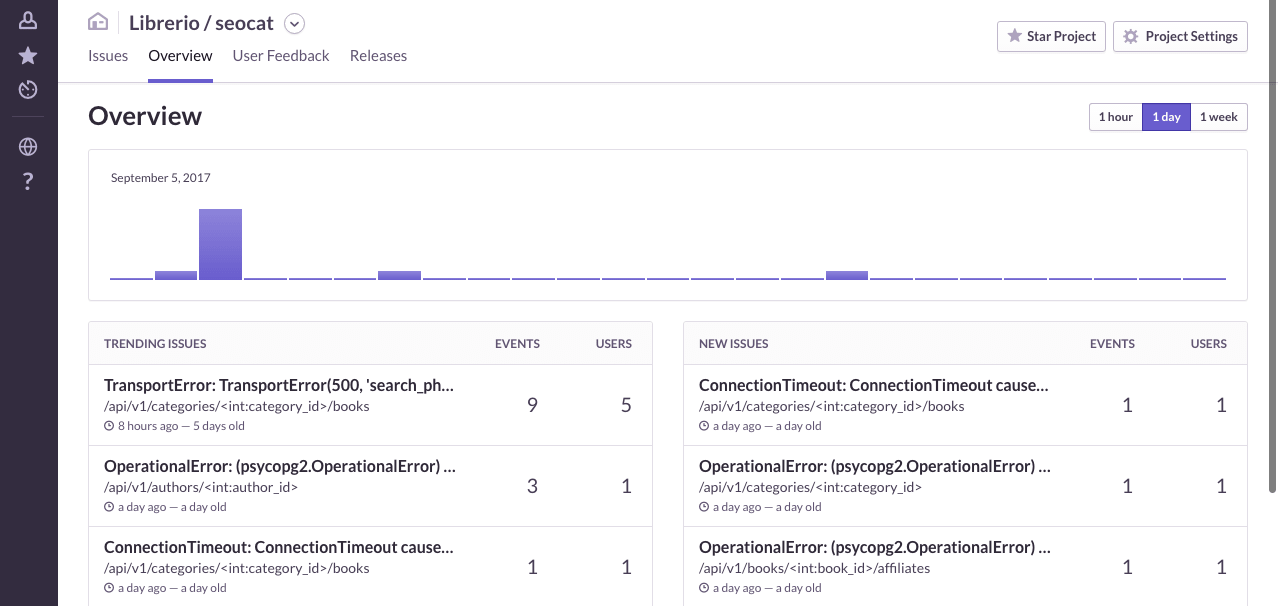
In this part of the series, I’m going to add Sentry to the monitoring stack. For those who do not know, Sentry is an open-source cross-platform crash reporting and aggregation platform written in Python. I know about it for several years now, since the time it supported only a few languages. A lot has changed since my last use of it: new domain, new languages, new integrations. Today it has integrations with most of the modern languages and frameworks like Elixir, React, React-Native, Go.
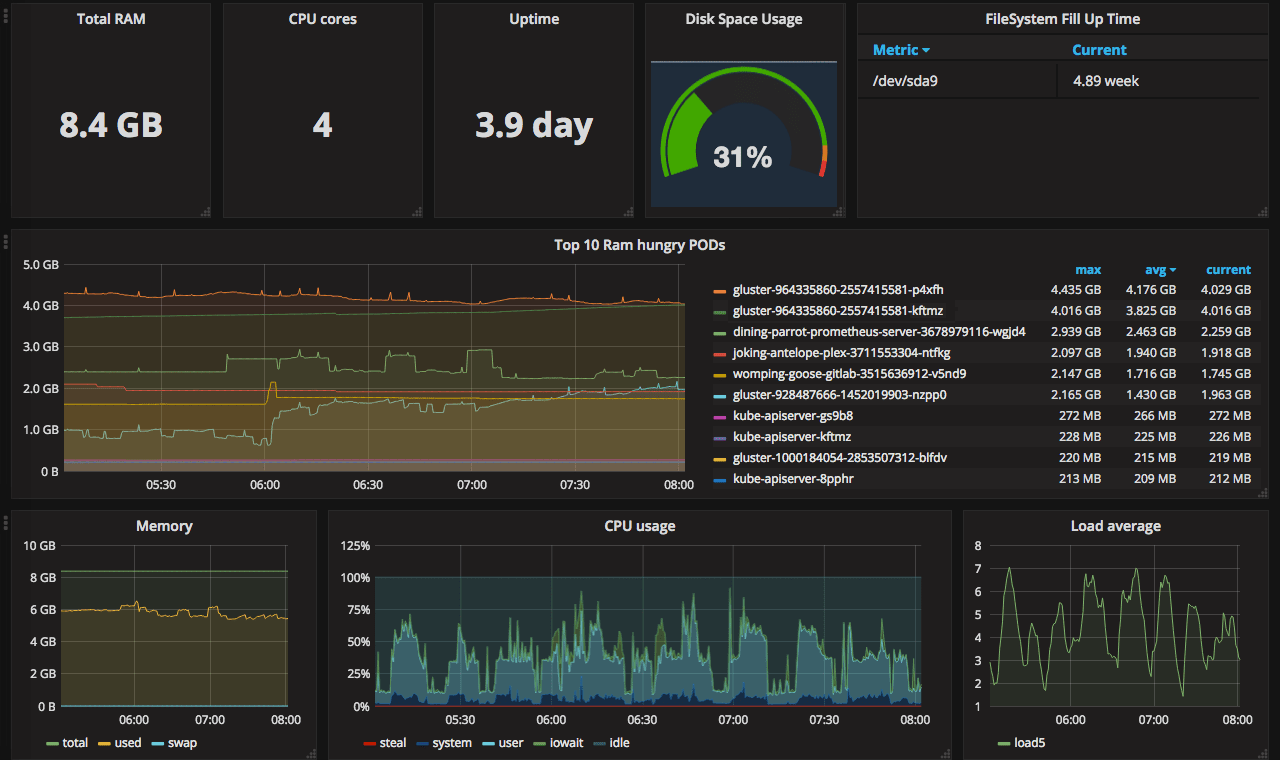
Going open-source in monitoring, part III: 10 most useful Grafana dashboards to monitor Kubernetes and services
Series of posts about migration from commercial monitoring systems to opensource. Replace NewRelic with Prometheus
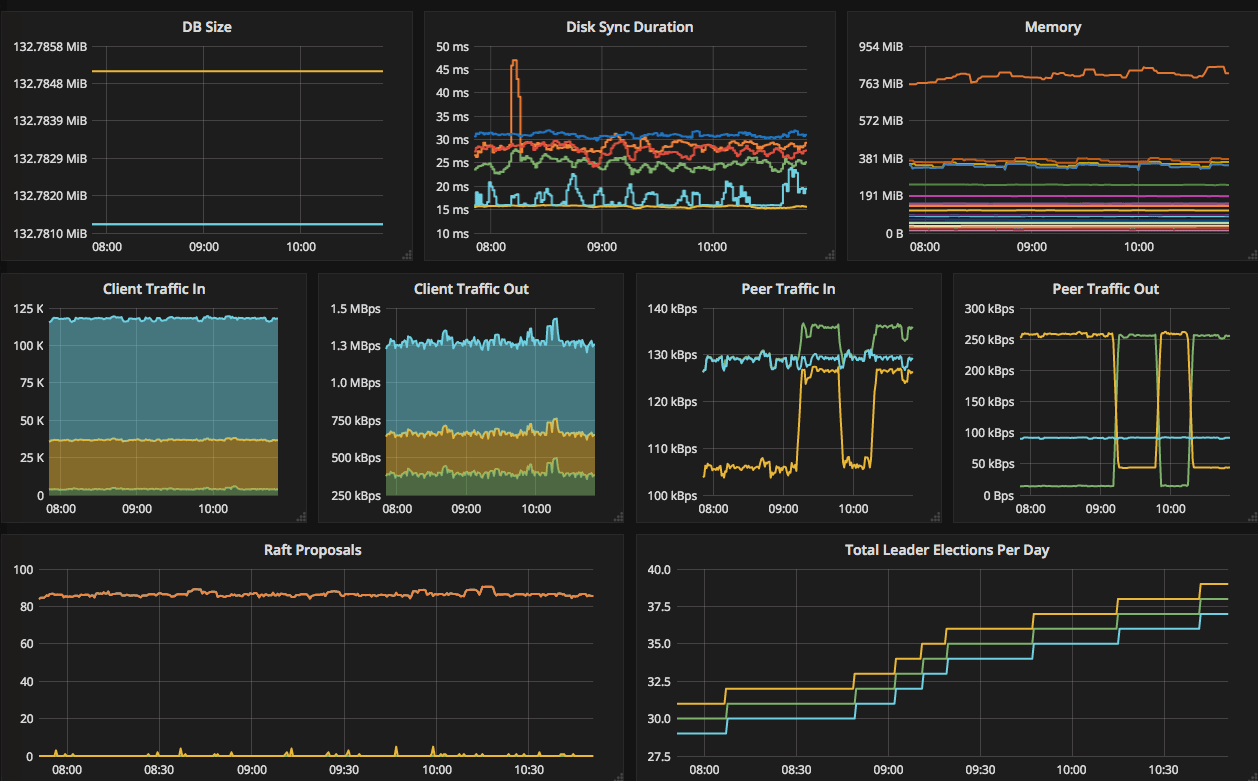
This post is one of a series of posts about monitoring of infrastructure and services. Other posts in the series: Intro Deploying Prometheus and Grafana to Kubernetes Creating the first dashboard in Grafana 10 most useful Grafana dashboards to monitor Kubernetes and services (this article) Configuring alerts in Prometheus and Grafana Collecting errors from production using Sentry Making sense of logs with ELK stack Replacing commercial APM monitoring SLA, SLO, SLI and other useful abstractions There are dozens of ready dashboards available on grafana.
Going open-source in monitoring, part II: Creating the first dashboard in Grafana
Series of posts about migration from commercial monitoring systems to opensource. Replace NewRelic with Prometheus
This post is one of a series of posts about monitoring of infrastructure and services. Other posts in the series: Intro Deploying Prometheus and Grafana to Kubernetes Creating the first dashboard in Grafana (this article) 10 most useful Grafana dashboards to monitor Kubernetes and services Configuring alerts in Prometheus and Grafana Collecting errors from production using Sentry Making sense of logs with ELK stack Replacing commercial APM monitoring SLA, SLO, SLI and other useful abstractions Having grafana.
