Going open-source in monitoring, part V: Collecting errors from production using Sentry
Series of posts about migration from commercial monitoring systems to opensource. Replace NewRelic with Prometheus
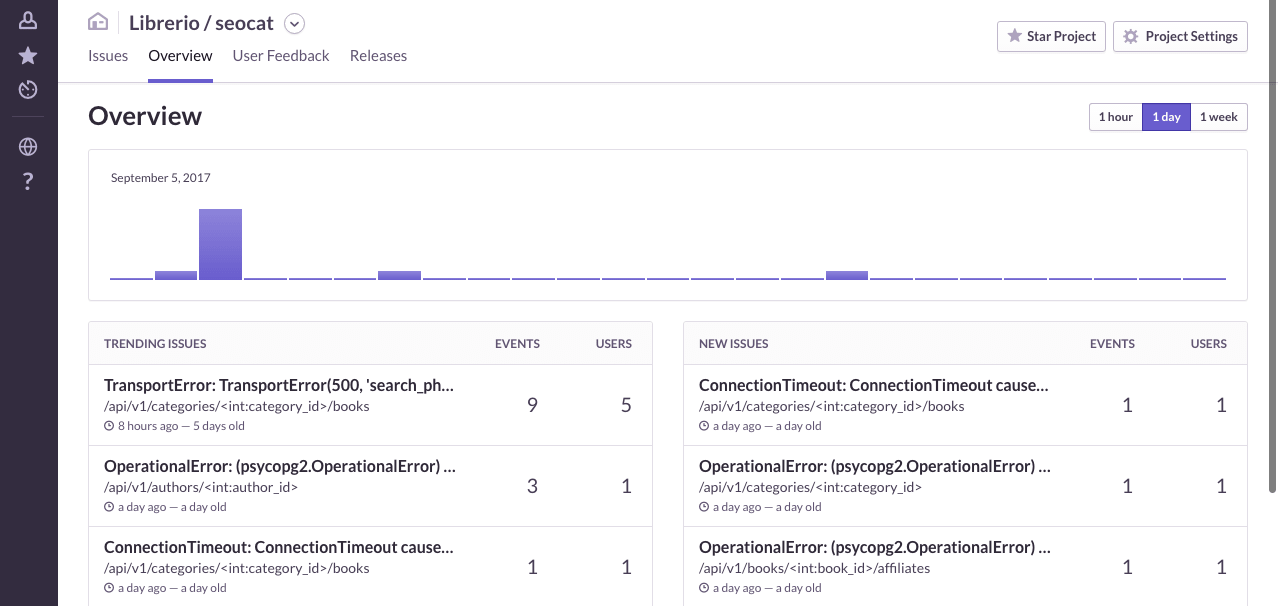
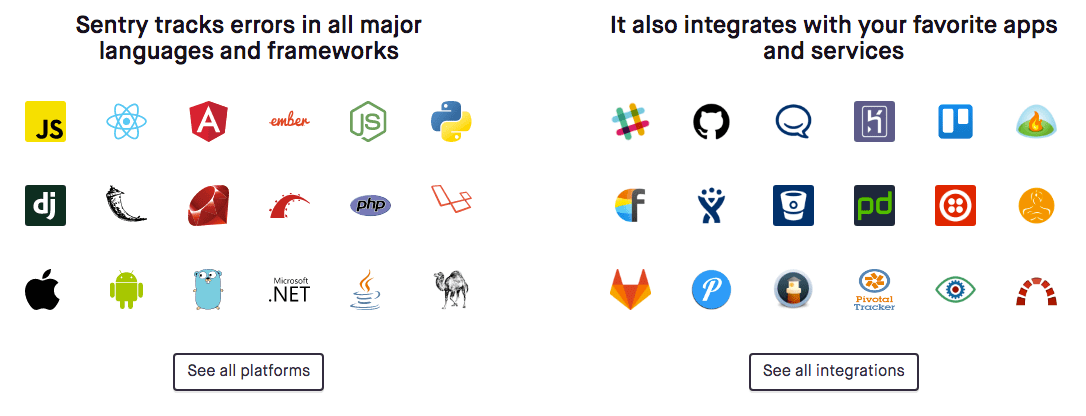
In this part of the series, I’m going to add Sentry to the monitoring stack. For those who do not know, Sentry is an open-source cross-platform crash reporting and aggregation platform written in Python. I know about it for several years now, since the time it supported only a few languages. A lot has changed since my last use of it: new domain, new languages, new integrations. Today it has integrations with most of the modern languages and frameworks like Elixir, React, React-Native, Go. Not to mention olds like Java, PHP or Python. The full list of languages is available on Github and official site.
This post is one of a series of posts about monitoring of infrastructure and services. Other posts in the series:
- Intro
- Deploying Prometheus and Grafana to Kubernetes
- Creating the first dashboard in Grafana
- 10 most useful Grafana dashboards to monitor Kubernetes and services
- Configuring alerts in Prometheus and Grafana
- Collecting errors from production using Sentry (this article)
- Making sense of logs with ELK stack
- Replacing commercial APM monitoring
- SLA, SLO, SLI and other useful abstractions
Installation on k8s
Sentry has several moving parts: server, workers, sql database and Redis. You can find a good chart in the kubernetes-charts repository which will work for most scenarios. The only missing features for me in this chart were the impossibility of using s3-like storage for persistence out of the box and the ability to use already existing databases. It was not hard to add it, but now I have to maintain my copy of the chart. Aside from this, configuration and installation are straightforward.
Sentry integrations
As I already mentioned sentry can collect errors from most of modern languages and frameworks. It also integrates with a bunch of applications and services. Some of it is shown in the screenshot.
In my current project I have:
- Python/Flask - most of the backend APIs so far
- Python/Scrapy - the best scraping framework out there
- Golang for some services
- Universal/Isomorphic React as frontend
I’m going to add sentry monitoring to all these systems, also I’m going to add integrations with Gitlab and Slack.
Collect reports from Python/Flask ✔
Integration with Flask is usually the easiest example of integration. You just add
from raven.contrib.flask import Sentry
sentry = Sentry(app, dsn='your dsn')
and you will start receiving all of your tracebacks. But this time I had to spend some extra time trying to debug SSL issues. It took way more time to debug since I was facing another SSL issue with a python-kubernetes client the same time. It turned out to be two separate problems with the same error :)
In [1]: from raven import Client
In [2]: client = Client('https://key:[email protected]/2')
In [3]: client.captureMessage('hello, world!')
Out[3]: '4ba5df0f8621406bbbce47a18b987c60'
In [4]: Sentry responded with an error: <urlopen error [SSL: CERTIFICATE_VERIFY_FAILED] certificate verify failed (_ssl.c:645)> (url: https://sentry.example.com/api/2/store/)
Traceback (most recent call last):
...
ssl.SSLError: [SSL: CERTIFICATE_VERIFY_FAILED] certificate verify failed (_ssl.c:645)
...
urllib.error.URLError: <urlopen error [SSL: CERTIFICATE_VERIFY_FAILED] certificate verify failed (_ssl.c:645)>
In the case with sentry, the problem was because raven (Python client for sentry) does not support SNI.
Server Name Indication (SNI) is an extension to the TLS computer networking protocol by which a client indicates which hostname it is attempting to connect to at the start of the handshaking process. This allows a server to present multiple certificates on the same IP address and TCP port number and hence allows multiple secure (HTTPS) websites (or any other Service over TLS) to be served by the same IP address without requiring all those sites to use the same certificate. It is the conceptual equivalent to HTTP/1.1 name-based virtual hosting, but for HTTPS.
Luckily it supports overriding of the transport protocol,
from raven.transport.requests import RequestsHTTPTransport
SENTRY_CONFIG = {
    'dsn': os.environ.get('SENTRY_DSN'),
    'transport': RequestsHTTPTransport,
}
After I found this fix, everything started to work.
Collect reports from Python/Scrapy ✔
Adding Sentry to Scrapy is similar. Just add a few settings to the config after installing the extension
# sentry dsn
SENTRY_DSN = 'http://public:[email protected]/1'
EXTENSIONS = {
    "scrapy_sentry.extensions.Errors":10,
}
Collect reports from isomorphic/universal react app ✔
Integration with client-side JS or with backend-side is easy. Making it work in Universal App is a bit trickier. As a solution for ReactStarterKit based project, I end up with something like this.
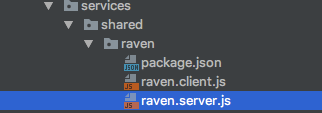
Have a package named raven which imports either raven.client.js or raven.server.js based on environment.
And then use it the same way in both server.js and client.js
# client/server
import Raven from './services/shared/raven';
import { sentry } from './config';

if (sentry.dsn) {
  Raven.config(sentry.dsn).install();
}
Collect reports from Golang ✔
package main

import "github.com/getsentry/raven-go"

func init() {
    raven.SetDSN("https://<key>:<secret>@sentry.io/<project>")
}
Integrations
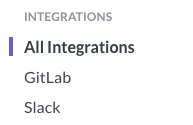
Sentry supports more than 25 integrations with other platforms, for now, I’m going to enable only two: gitlab and slack. In Sentry, you can enable a different set of apps for each project. To do it you need to go the project settings Open Project → Project Setting and select All Integrations in the side menu. You will get a list of all available integration to select. After saving you will have your integrations listed in the side menu.
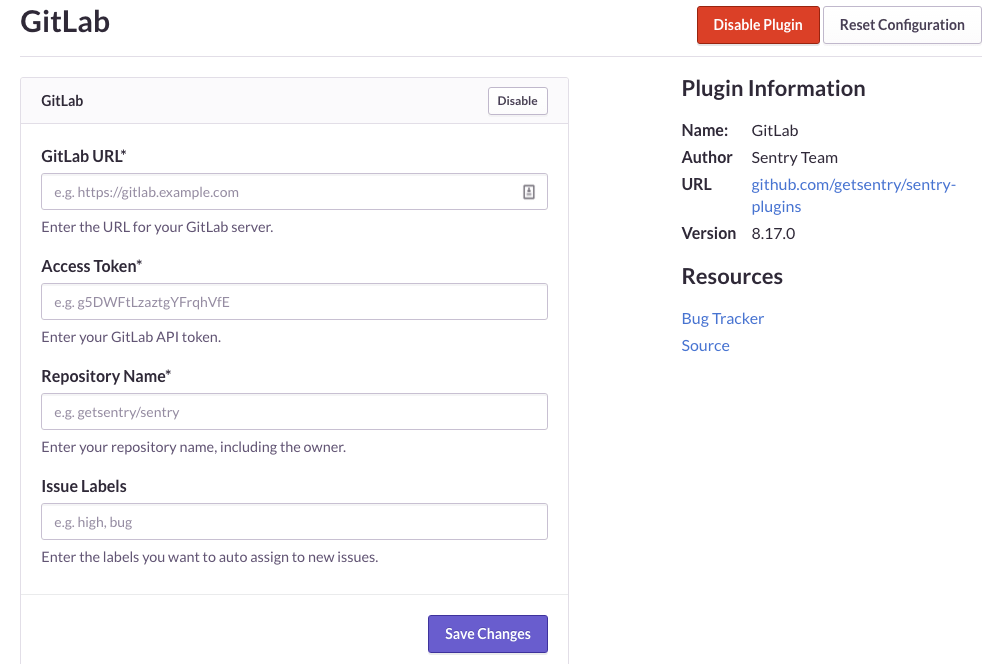
Gitlab
After enabling Gitlab you need to configure it. You will need to create an Access Token in Gitlab and enter it in the Configuration page of Sentry.
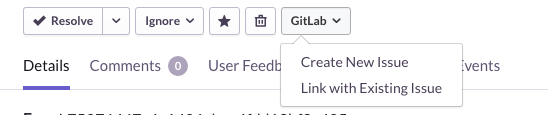
At the end, you will have a nice Gitlab button on the toolbar. It gives you ability to associate Sentry stacktrace with a new or Existing Gitlab issue in a few clicks.
Slack
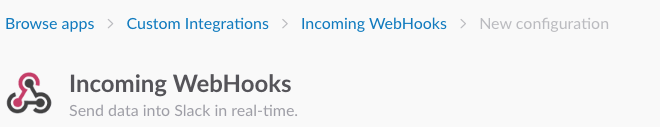
Connecting slack is easy as everywhere. First, you need to create new webhook configuration in team settings on Slack: https://your-team.slack.com/apps/manage/custom-integrations.
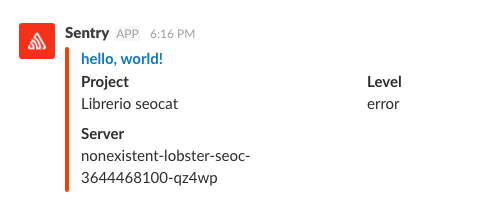
You’ll get a webhook URL that you’ll need to enter in Sentry on the Slack settings page. It has few other common settings like selecting a channel to post to, customising tags or bot name.
Wrap up
Sentry became a very mature product with a lot of supported frameworks and integrations. It is really easy to configure, at least in languages I’ve tried, and use. Excluding the SNI issue, it took me just a few hours to install it in Kubernetes and add it to all my projects. I believe it is the best opensource solution in the field available today.
Stay tuned.

Share this post
Twitter
Google+
Facebook
Reddit
LinkedIn
StumbleUpon
Email