Going open-source in monitoring, part III: 10 most useful Grafana dashboards to monitor Kubernetes and services
Series of posts about migration from commercial monitoring systems to opensource. Replace NewRelic with Prometheus
This post is one of a series of posts about monitoring of infrastructure and services. Other posts in the series:
- Intro
- Deploying Prometheus and Grafana to Kubernetes
- Creating the first dashboard in Grafana
- 10 most useful Grafana dashboards to monitor Kubernetes and services (this article)
- Configuring alerts in Prometheus and Grafana
- Collecting errors from production using Sentry
- Making sense of logs with ELK stack
- Replacing commercial APM monitoring
- SLA, SLO, SLI and other useful abstractions
There are dozens of ready dashboards available on grafana.net/dashboards and Github.
Many of them just work, but many do not. In most cases, you just need to fix template variables, but some require deeper involvement.
For example dashboard for PostgreSQL monitoring. After import, it welcomes you with the error message “Datasource named ${DS_PROMETHEUS} was not found”. Setting the correct datasource name in dashboard settings does not help because it has an error in __inputs declaration. The easiest way to fix it is to edit JSON before import.
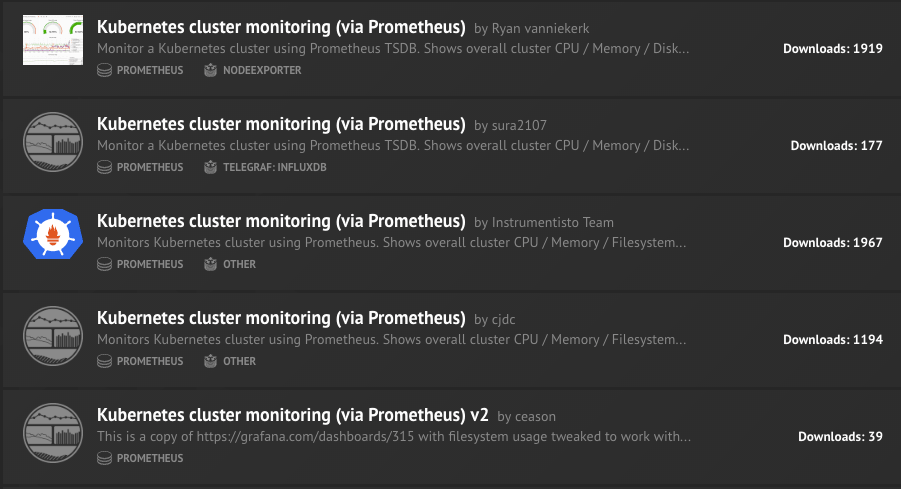
It takes time to find useful dashboards, make them work for you and then choose one. For example, if you’ll search for Kubernetes dashboards with datasource Prometheus you’ll get, among others, 5 results with the same name.
In this post, I want to cover some of the most useful dashboards available to help you monitor your Kubernetes cluster and services deployed on it.
Cluster view
Kubernetes cluster overview - #1621 or #315
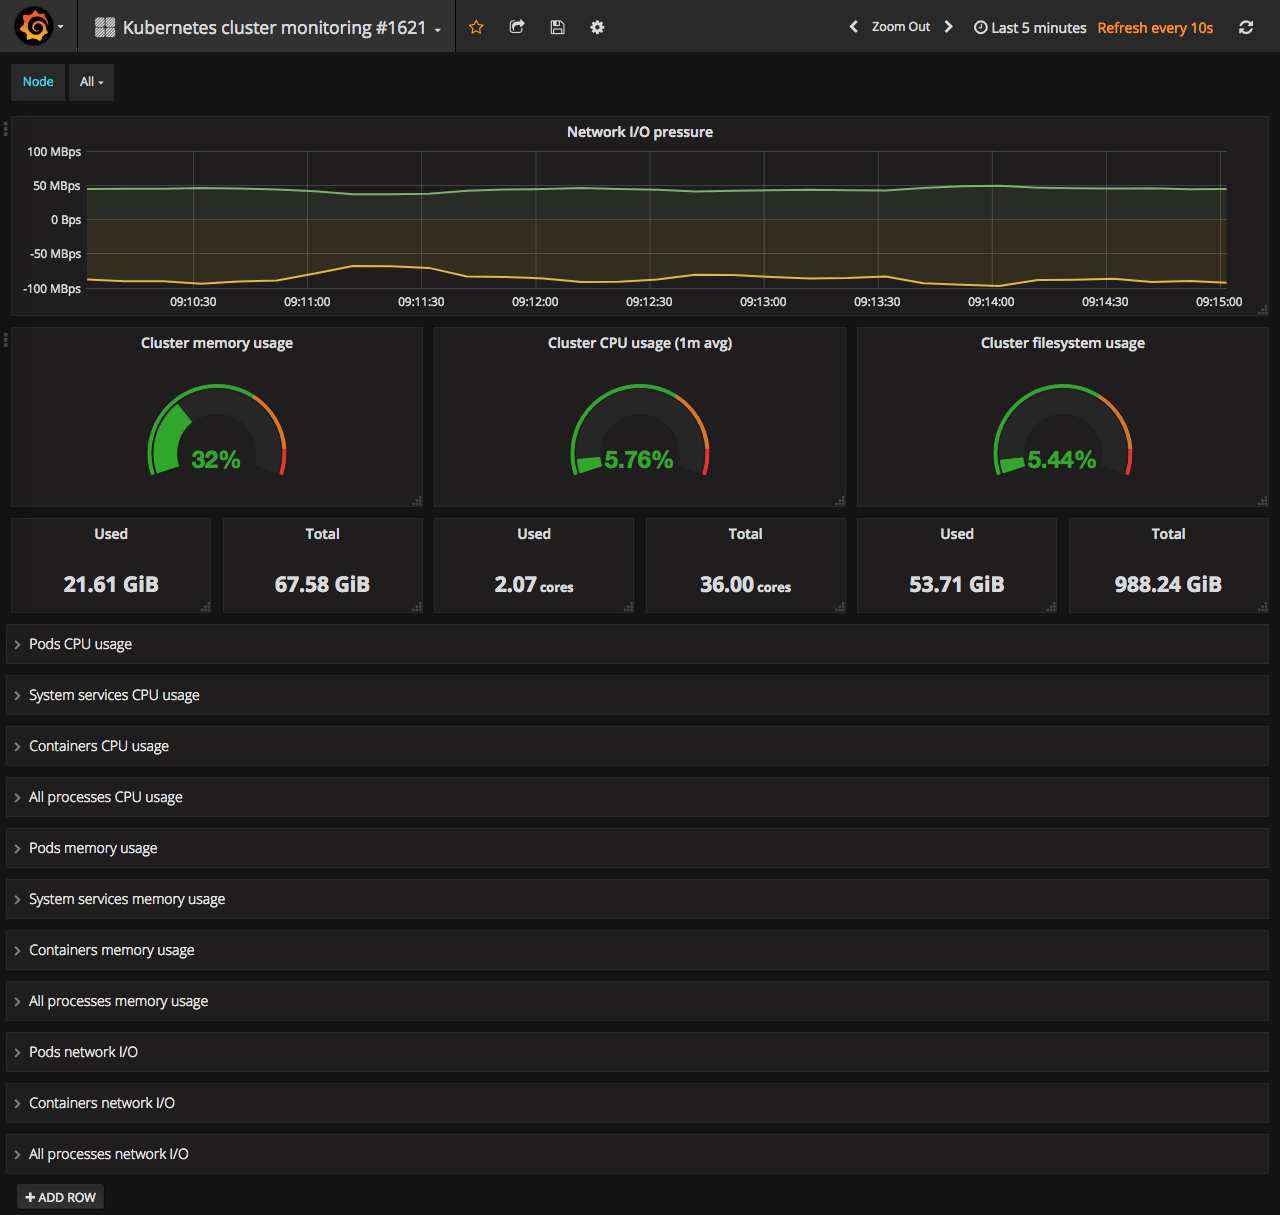
This dashboard usually the first one you search for after deploying Kubernetes + Prometheus. Among the 5 shown in the screenshot above only 2 is really good. Actually, it is the same dashboard saved by two people.
Node view
Detailed node overview - #1860
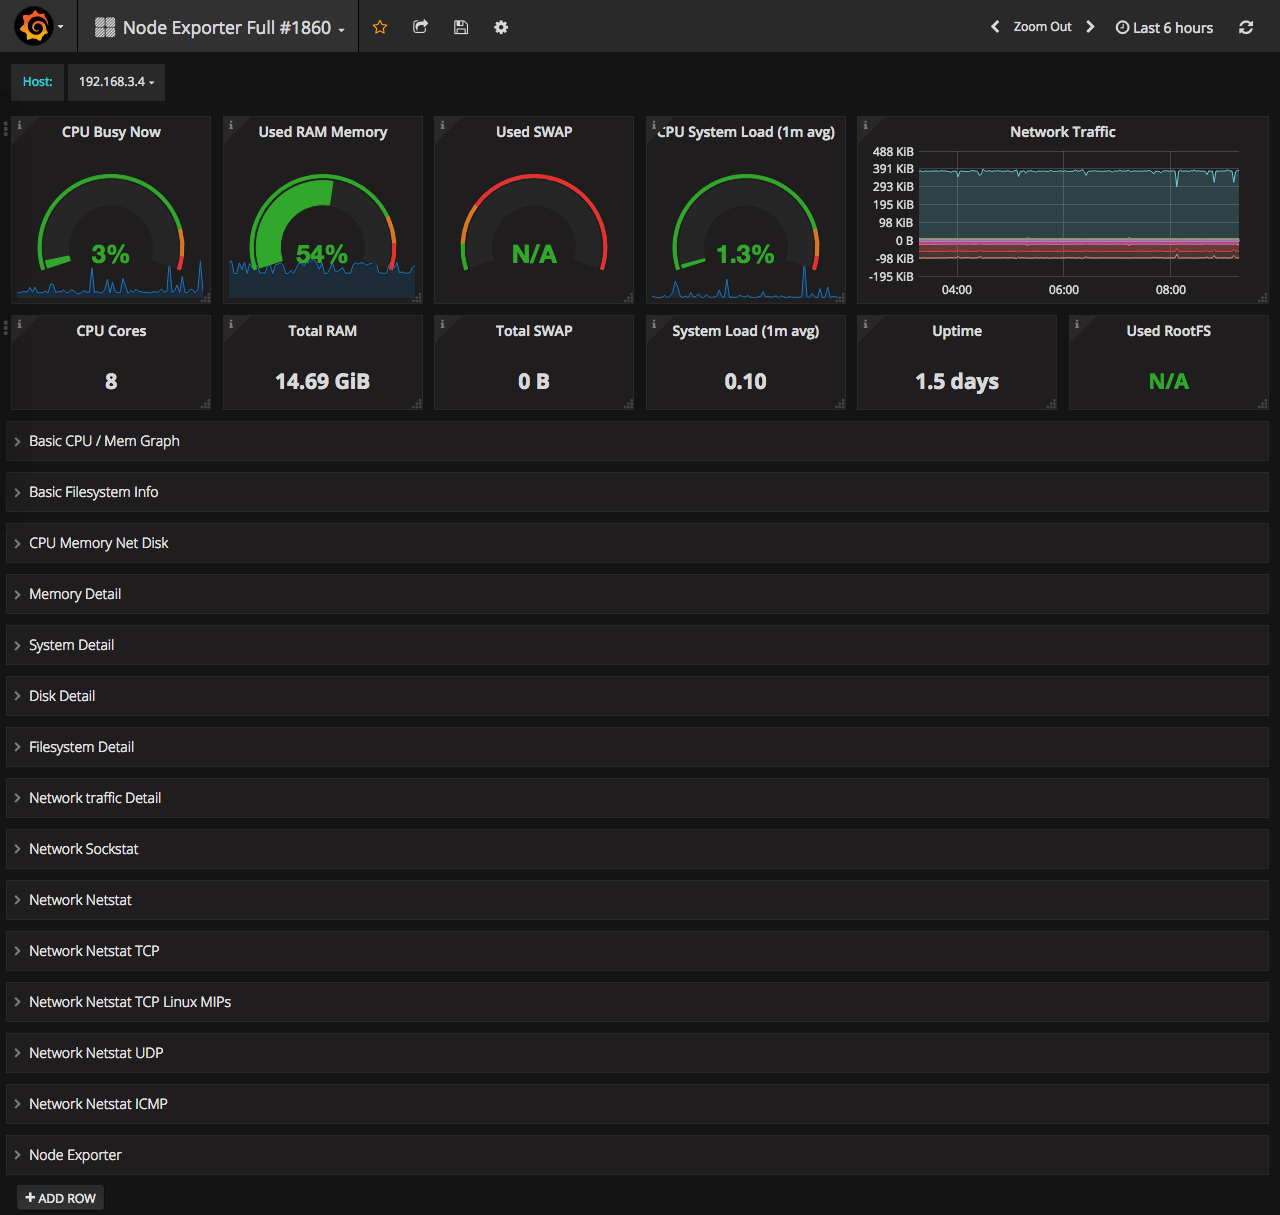
This one is great when you need to understand what is wrong with the particular node. It has much more stats compared to the cluster overview.
Deployment metrics monitoring
Kubernetes Deployment metrics - #741
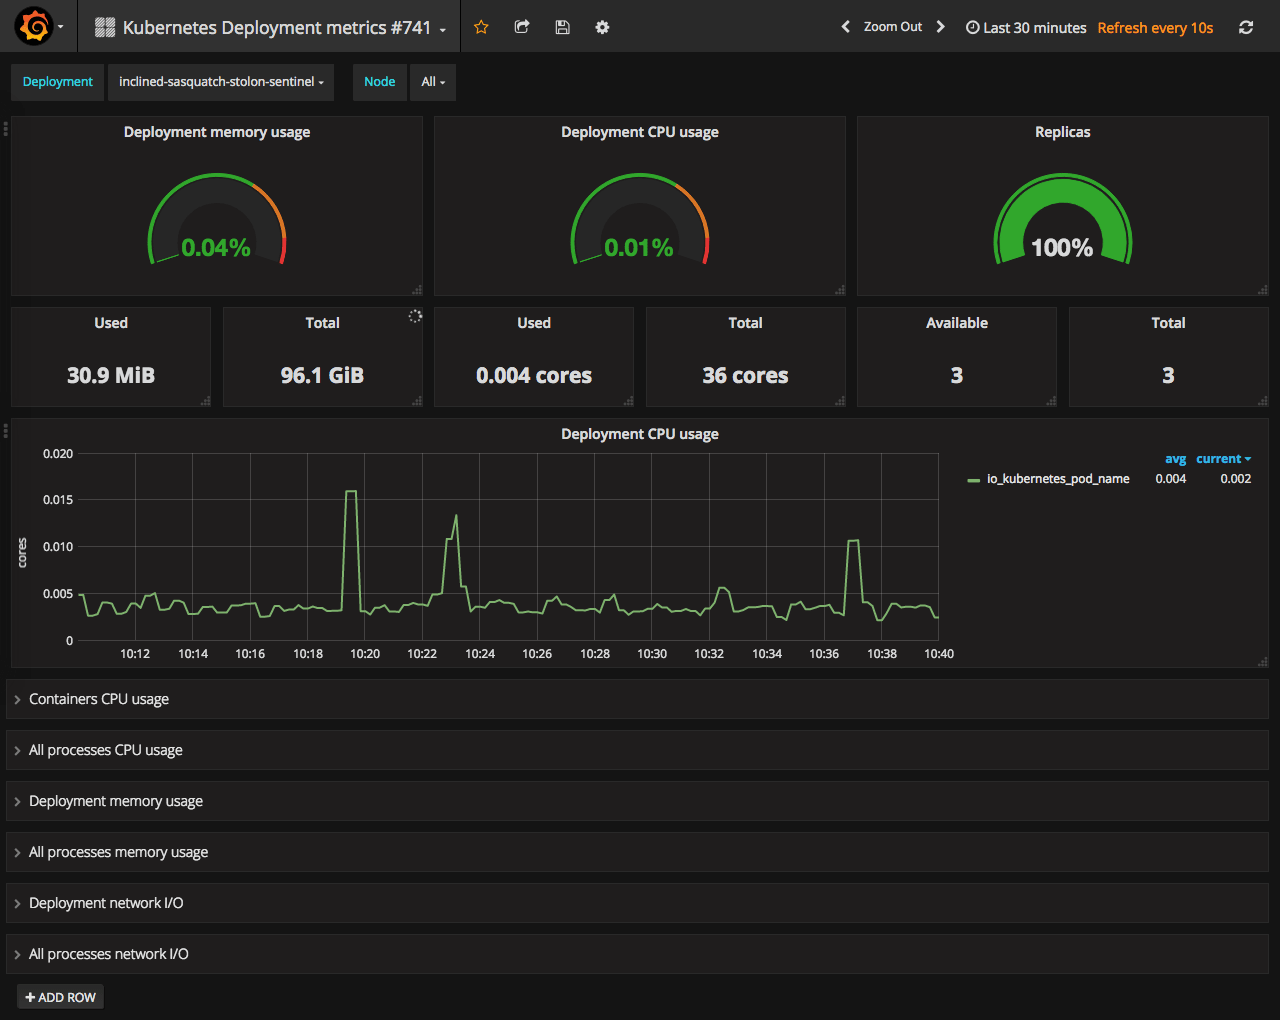
Next level of monitoring after the node - deployment. This dashboard will show you everything about selected deployment.
Pod metrics monitoring
Kubernetes Pod Metrics - #747
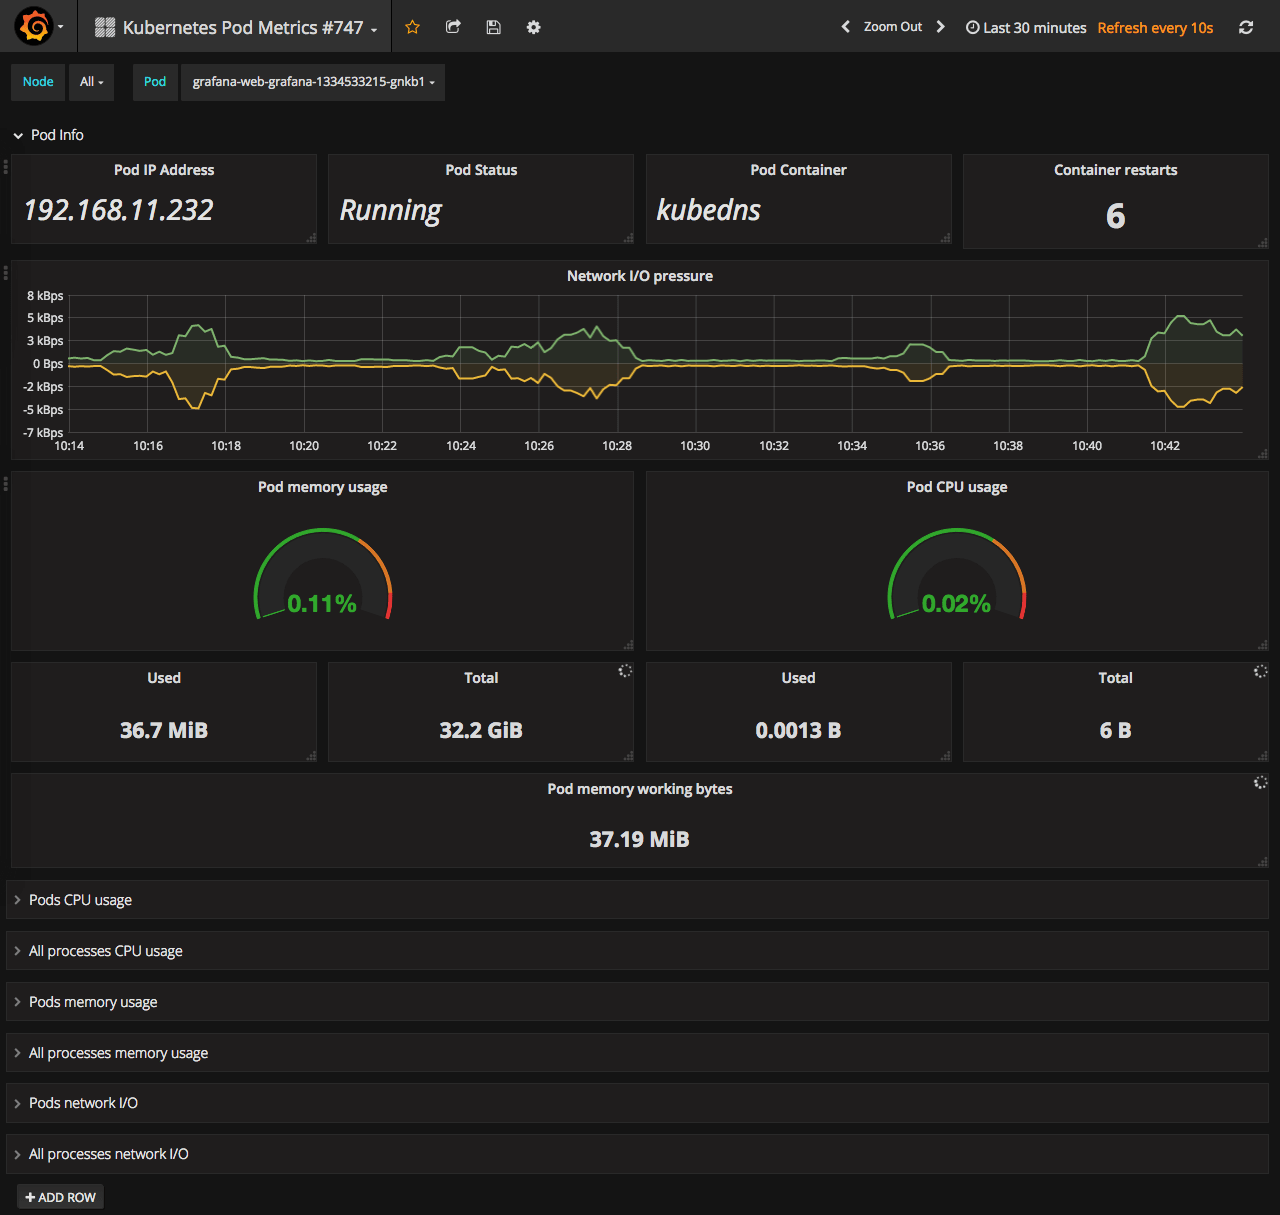
Pod level monitoring. Shows mostly the same stats as the deployment dashboard but on Pod level. Pod info row shows some random values in Pod container and Pod IP Address places, but other values seem fine.
Application metrics monitoring
Kubernetes App Metrics - #1471
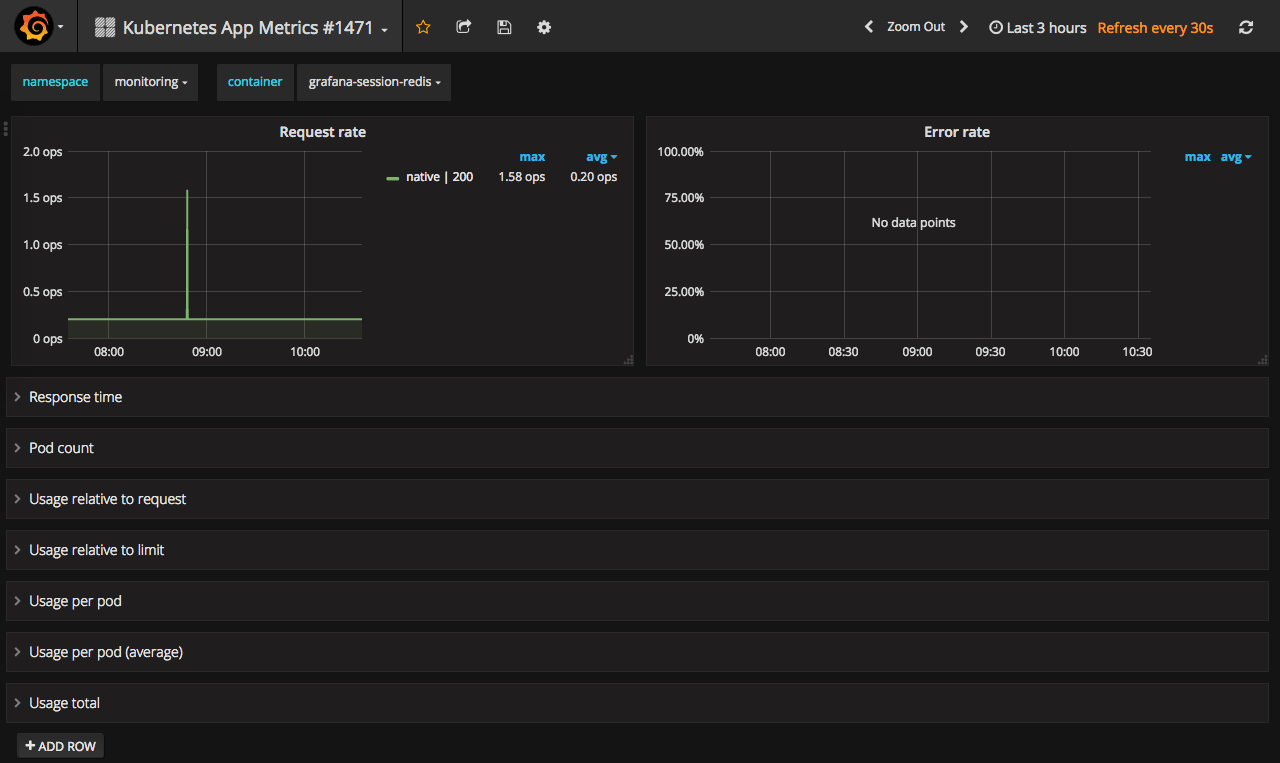
This one is good as an example of how to monitor your application deployed to Kubernetes. It has metrics like request rate, error rate and response times for your application alongside with different resource usage stats.
PostgreSQL
Postgres Overview - #455
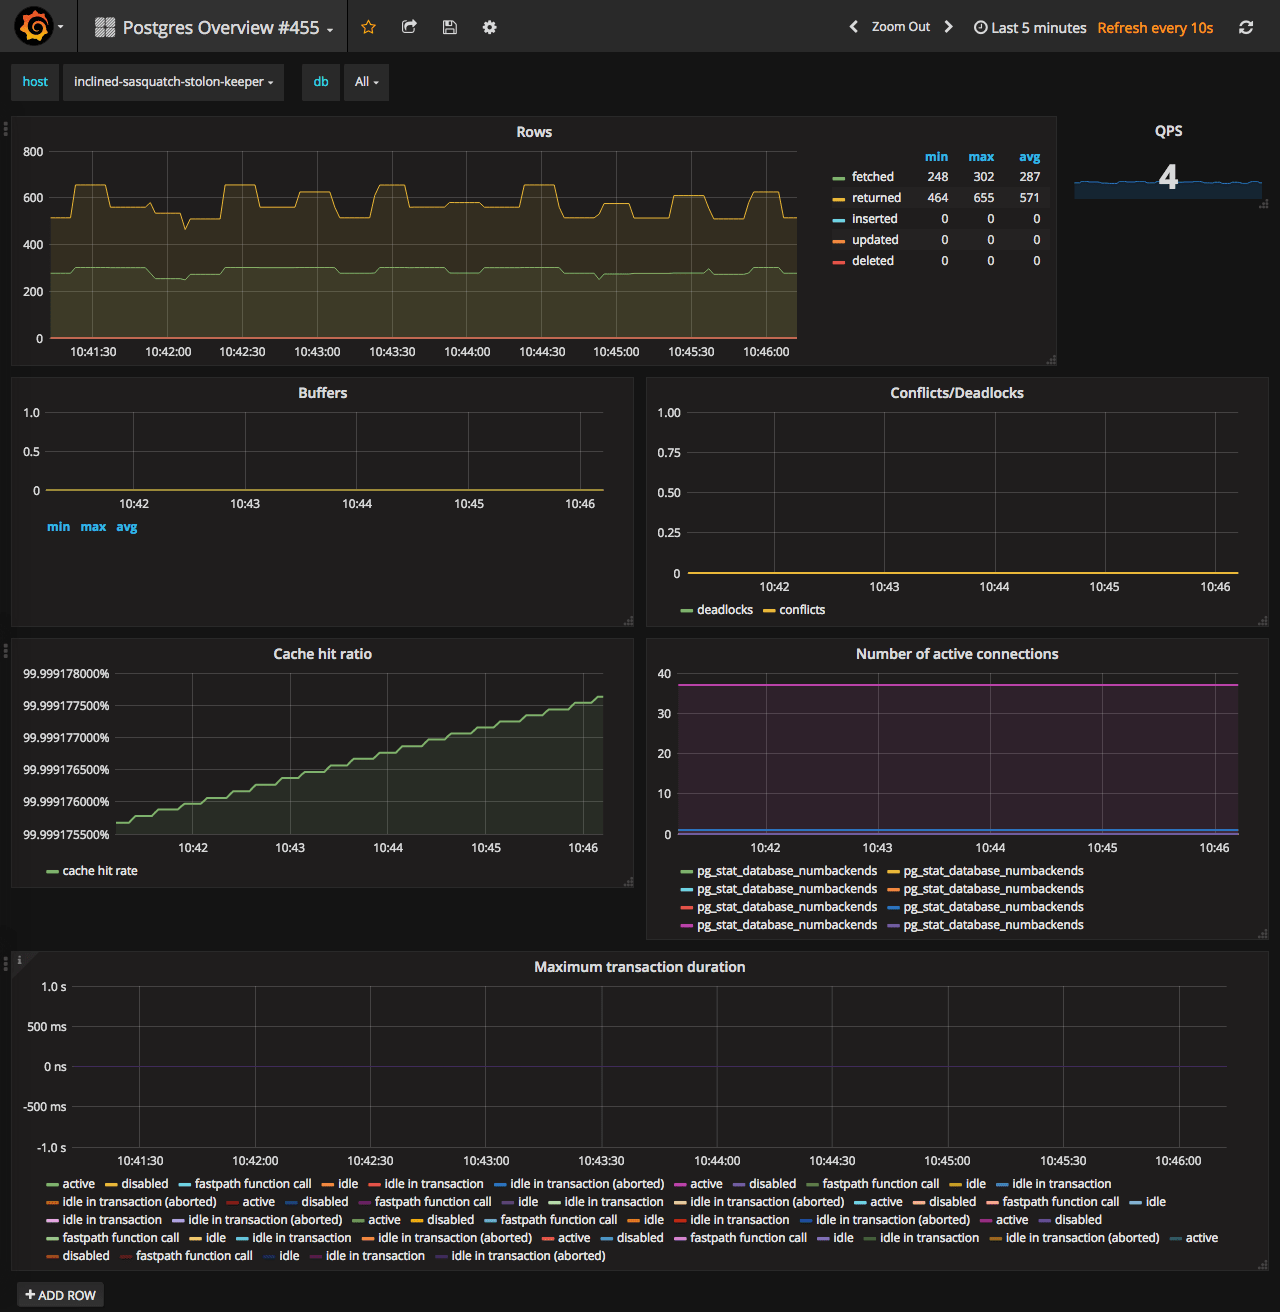
After you fix the broken variable declaration - it just works :) I saved fixed one here
ElasticSearch
Elasticsearch cluster overview #266
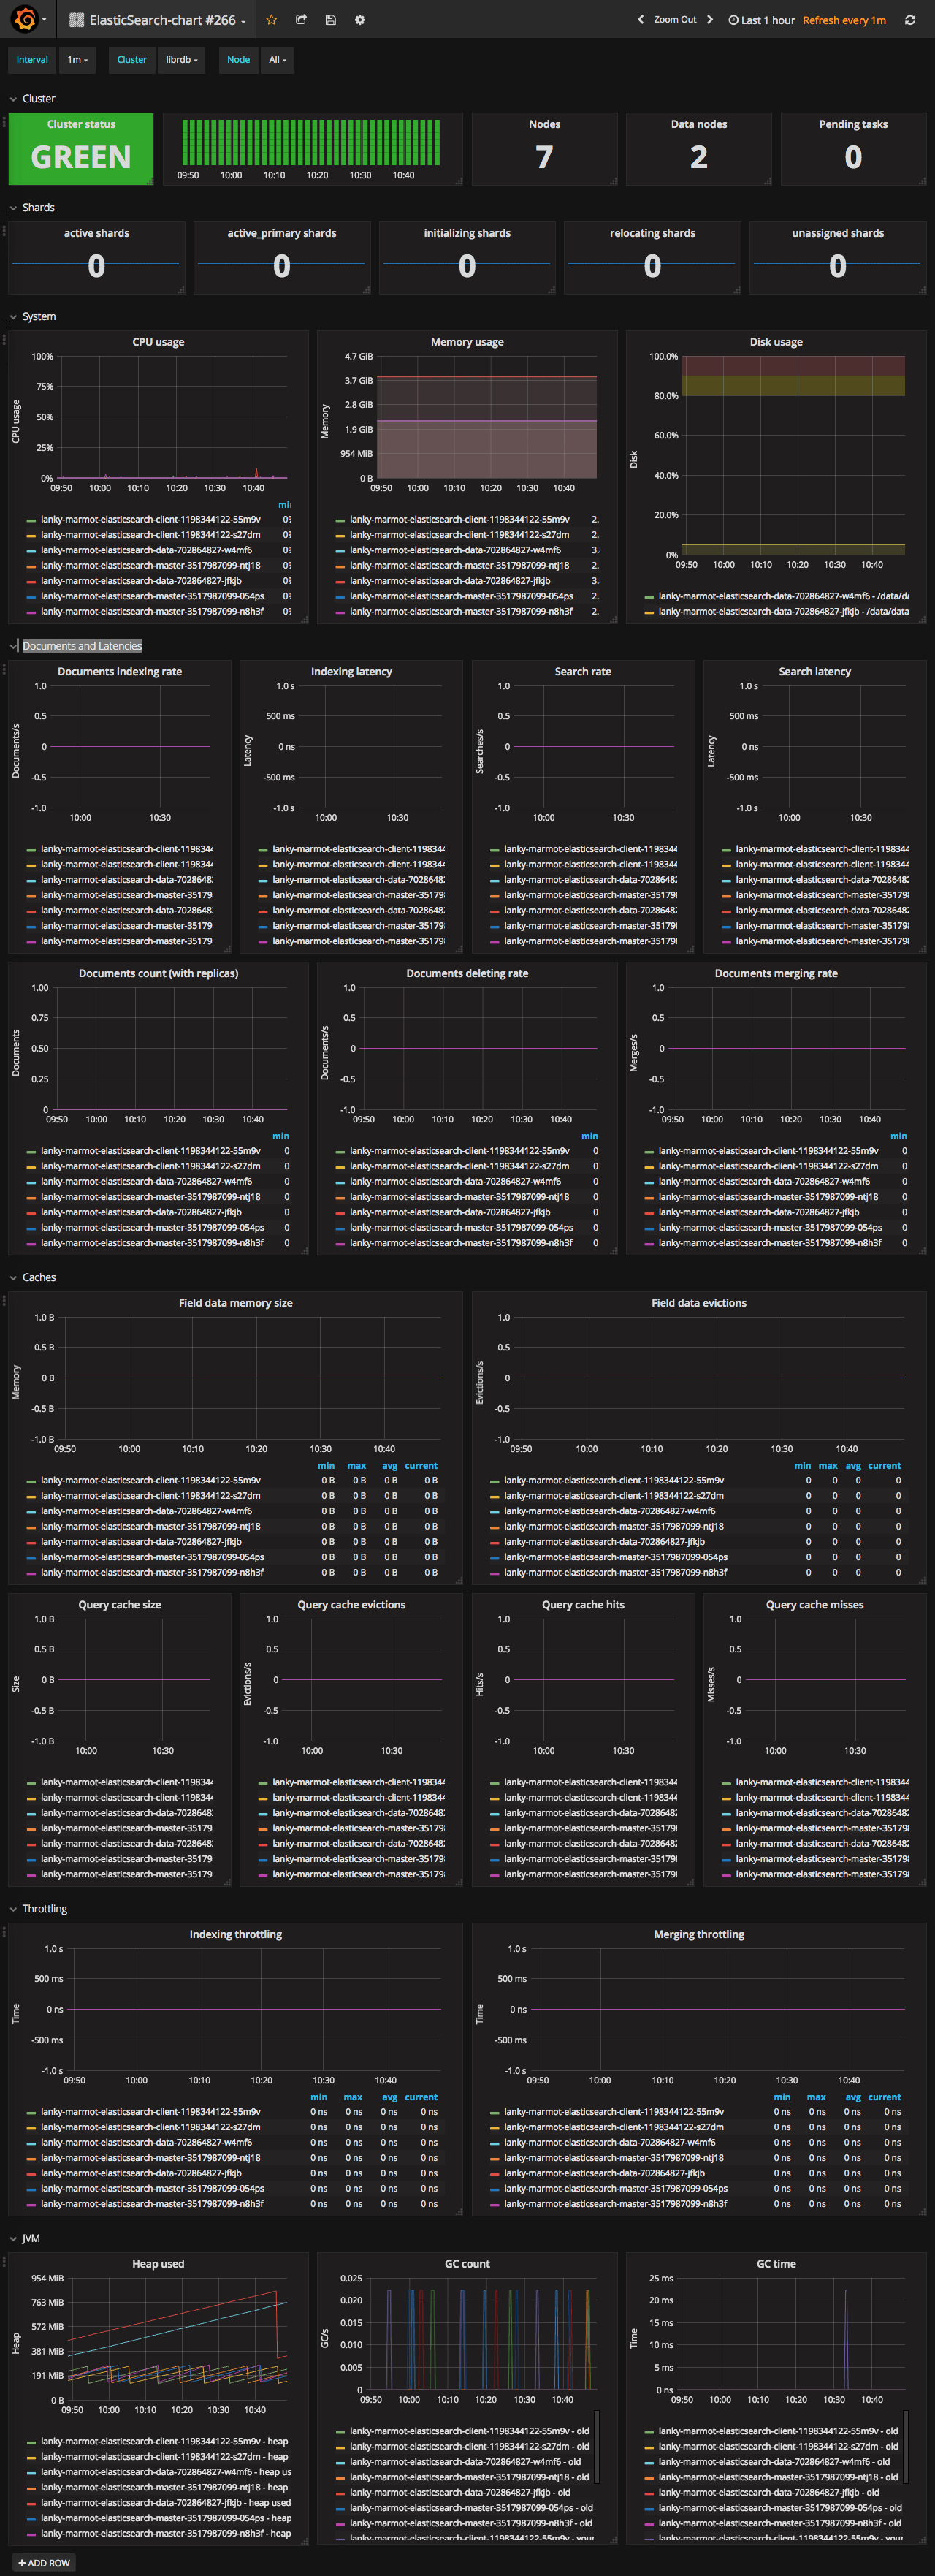
The best one so far is 266. It supports most of the metrics needed and required least amount of tweaks to make it work. There are several other options - 2322, 2347, 718. But they either lack graphs or did not work at all for me.
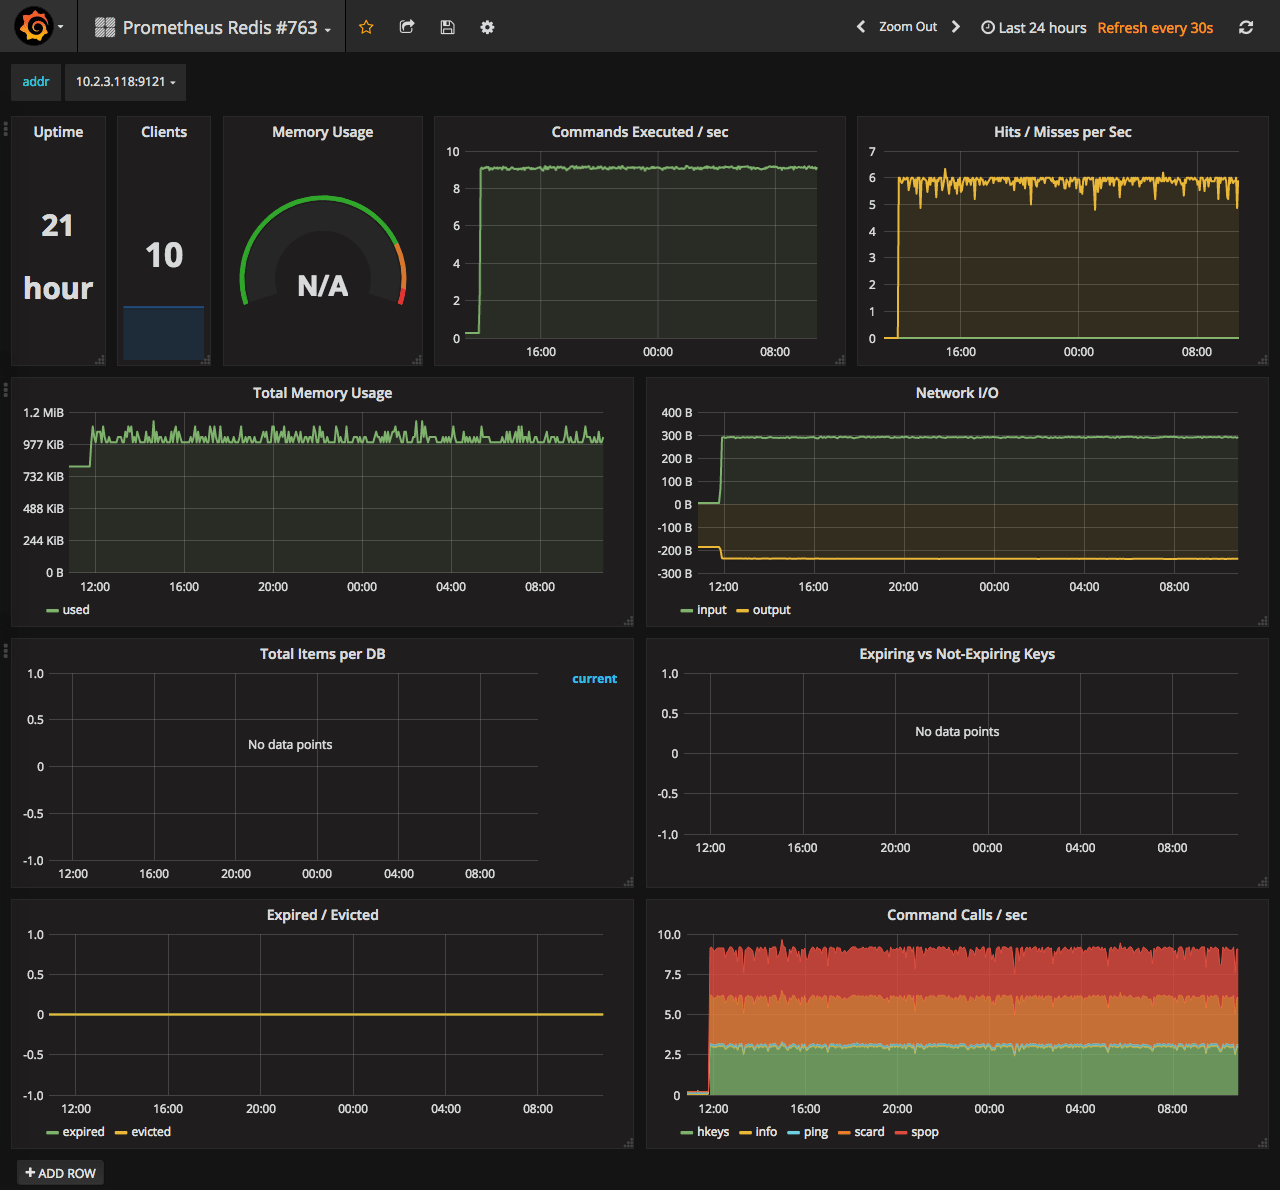
Redis
Prometheus Redis - #763
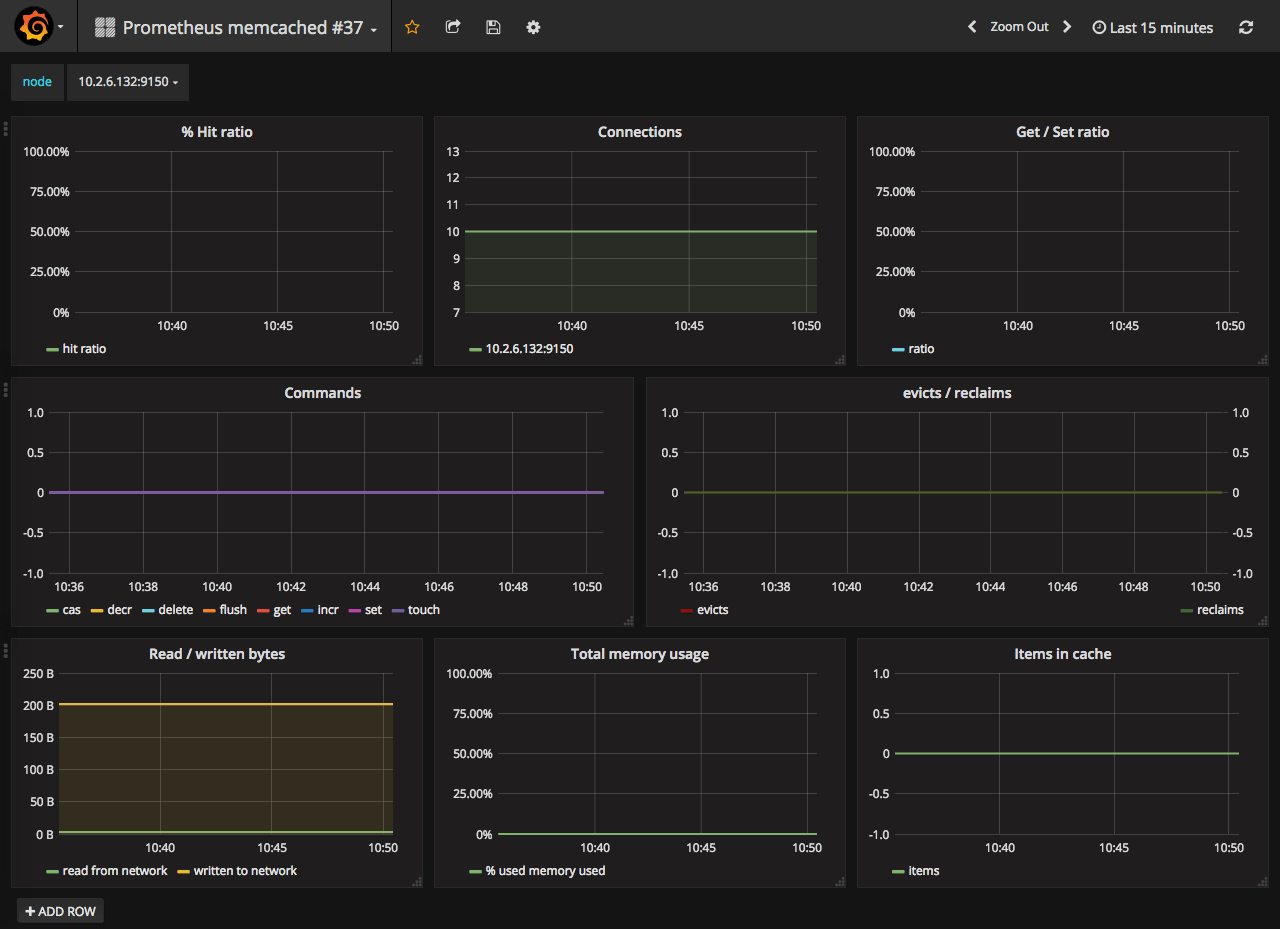
Memcached
Memcached node - #37
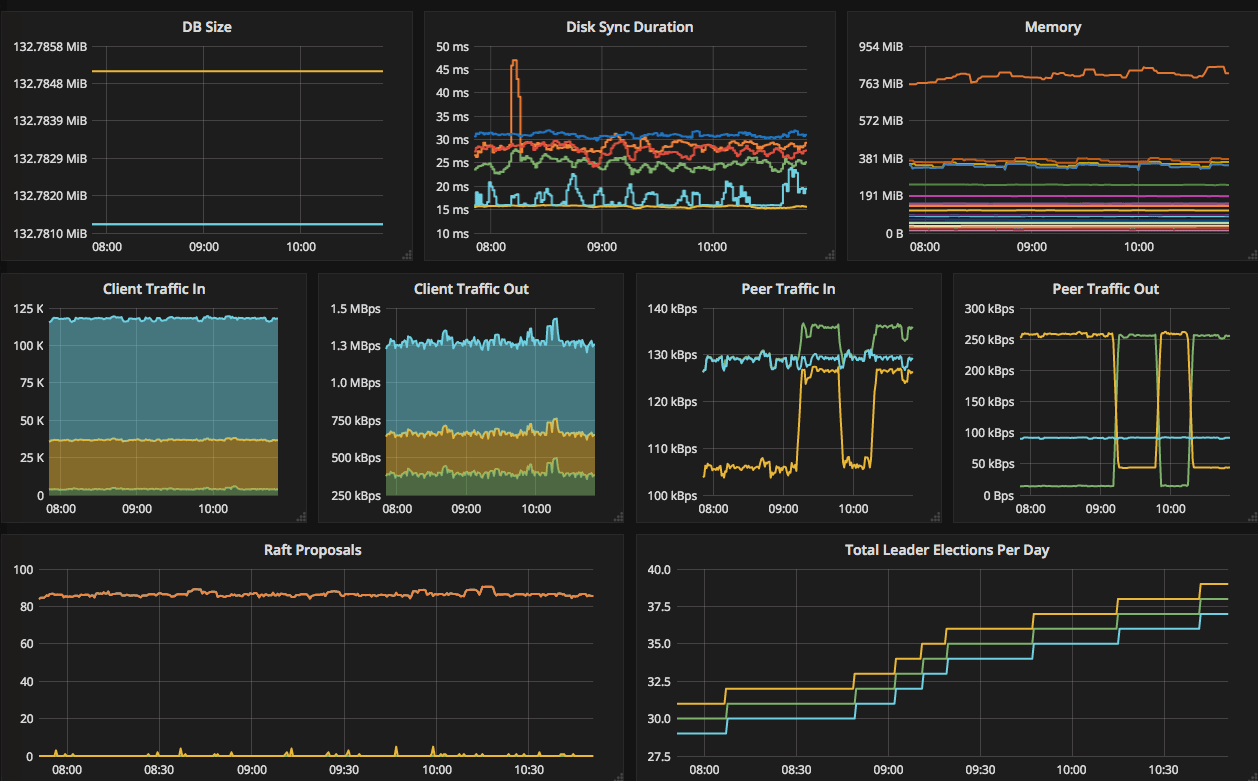
Etcd
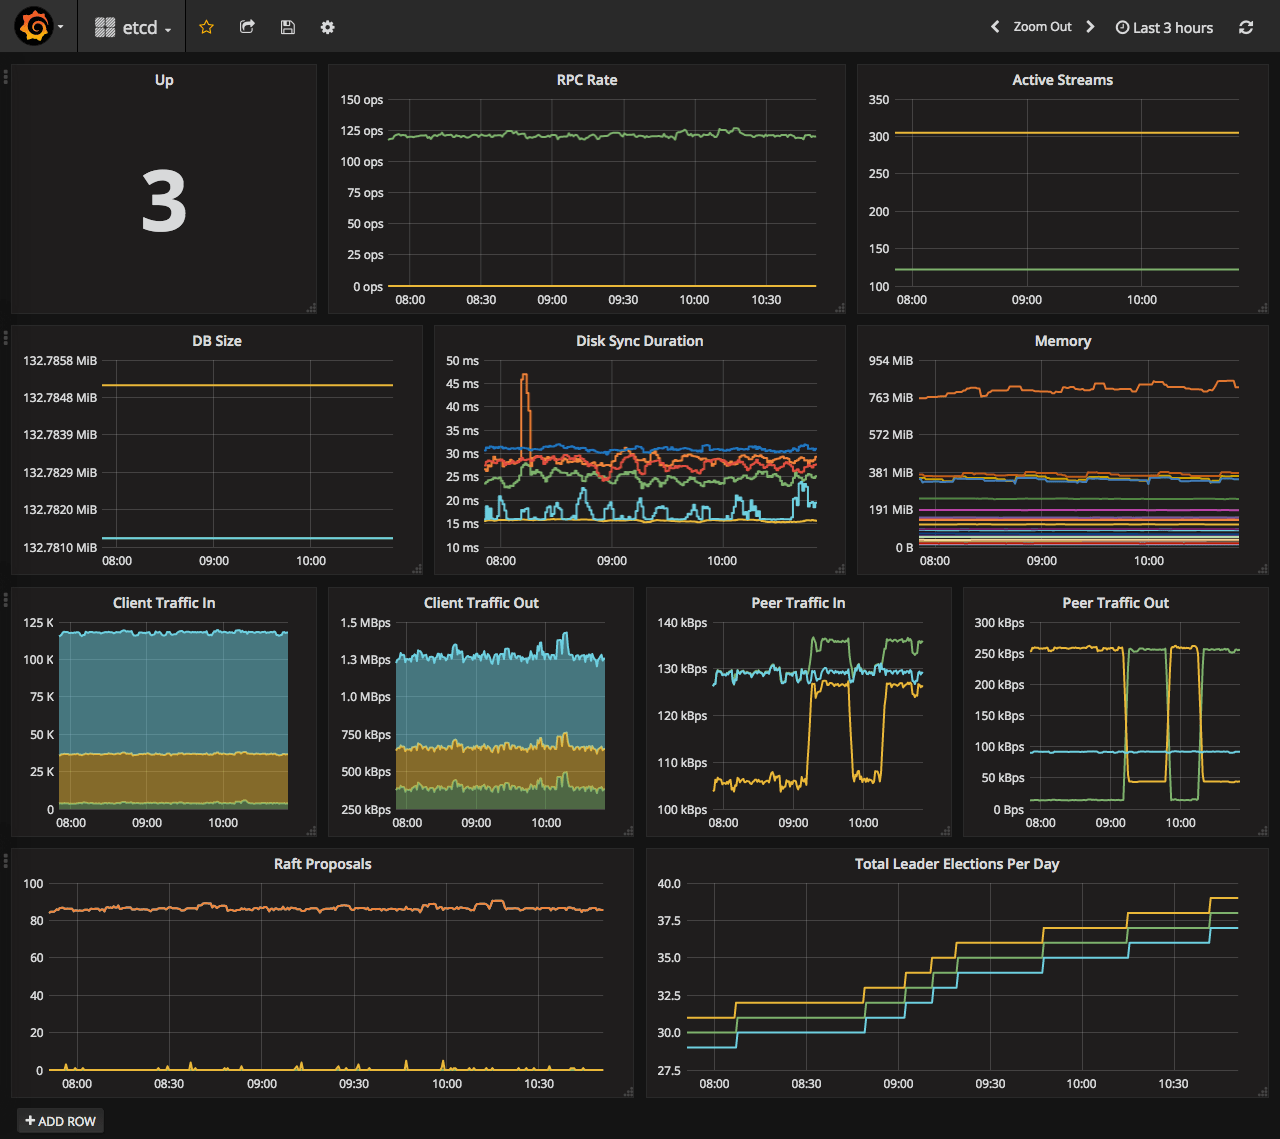
Monitoring of Etcd is covered on CoreOS website here. Dashboard suggested in this manual has hardcoded datasource, so you have to edit it before import. So I made datasource configurable and saved it in the repo here. By default, Etcd is not monitored by Prometheus at all. So, you need to tell it where your Etcd lives. If you have self-hosted Etcd annotations to the Etcd service will work, otherwise, you need to update prometheus config with the location on your Etcd nodes.
  - job_name: etcd
    static_configs:
    - targets: ['10.240.0.32:2379','10.240.0.33:2379','10.240.0.34:2379']
Wrap Up
That’s it. At this point, we can monitor health of the Kubernetes cluster and several common services. Sources for PostgreSQL and Etcd dashboards, with changes I did, are available on GitHub.
Stay tuned.

Share this post
Twitter
Google+
Facebook
Reddit
LinkedIn
StumbleUpon
Email