Going open-source in monitoring, part I: Deploying Prometheus and Grafana to Kubernetes
Series of posts about migration from commercial monitoring systems to opensource. Replace NewRelic with Prometheus
This post is one of a series of posts about monitoring of infrastructure and services. Other posts in the series:
- Intro
- Deploying Prometheus and Grafana to Kubernetes (this article)
- Creating the first dashboard in Grafana
- 10 most useful Grafana dashboards to monitor Kubernetes and services
- Configuring alerts in Prometheus and Grafana
- Collecting errors from production using Sentry
- Making sense of logs with ELK stack
- Replacing commercial APM monitoring
- SLA, SLO, SLI and other useful abstractions
I’ve been keeping my eye on Prometheus for some time. What I like about it - is its pull nature and great integration with service discovery and Kubernetes.
With pull system, you do not have to tell every service you have where the monitoring system is located. You just need to expose your metrics as a plain text using HTTP and Prometheus will access this endpoint and pull the data. The system will never fail because your monitoring service ran out of space or overloaded.
Among other advantages, for me, are: it is written in Go, easy to deploy and inspired by Google’s Borgmon system. It’s not that I like stuff created by Google, but I think it really makes sense to use Borgmon-inspired system to monitor Borg-inspired container management system - Kubernetes :)

The Prometheus system consists of several components:
- Prometheus server which scrapes and stores metrics
- Exporters which expose metrics for well-known services
- Alertmanager to send notifications and alerts on events
- Push gateway, client libraries to build custom monitoring solutions.
Planning resources
Memory usage could be configured by setting storage.local.target-heap-size flag. Its default value is 2GiB which corresponds to about 200,000 time series simultaneously present in memory. This value should be set to 2⁄3 of the physical memory limit. That means that we should set resource limit for the container to 3GiB.
Prior to v1.6, there was no flag
storage.local.target-heap-size. Instead, the number of chunks kept in memory had to be configured using the flagsstorage.local.memory-chunksandstorage.local.max-chunks-to-persist. These parameters are covered in this article.
Storage. The size of the storage needed for the system depends on 2 parameters: retention rate and the number of time series. After some observations in the staging environment I ended up with such numbers: ~90k metrics collected for 2 weeks have a size of around 40G on disk. To be on the safe side I have set retention to 1 month and created 100G volume for Prometheus data. Retention rate could be set using storage.local.retention setting.
More information about configurations could be found in the operations/storage section of the docs. This page also has link to great talks about Prometheus - The Prometheus Time Series Database, Configuring Prometheus for High Performance.
Installation on Kubernetes
There are several ways to install Prometheus on Kubernetes: Helm chart, CoreOS’s operator and of course the manual way.
In this post, I’m going to use the helm chart to install and configure both Prometheus and Grafana.
First of all, make sure you have helm installed and configured. If not - install it.
Now, we need to create a configuration file for our chart. To not start from scratch, let’s download default values from the chart
$ mkdir prometheus && cd prometheus
# save the default values
$ wget https://raw.githubusercontent.com/kubernetes/charts/master/stable/prometheus/values.yaml
This file consists of a several parts:
- server + serverFiles - configurations related to Prometheus itself
- alertmanager + alertmanagerFiles - configurations related to alertmanager. Alertmanager is not covered in this post. A separate post is planned for it.
- nodeExporter and kubeStateMetrics - configurations for two exporters shipped with the chart. One will expose various metrics about the nodes, the second - kubernetes related metrics. Their defaults are fine and do not require any changes.
- configmapReload - settings for confimap reload sidecar. configmapReload is a small binary to trigger a reload of the service when Kubernetes ConfigMaps are updated. We’re not going to change defaults here.
Let’s start with the server. Here is the corresponding part of the current default.
server:
  ## Prometheus server container name
  ##
  name: server

  ## Prometheus server container image
  ##
  image:
    repository: prom/prometheus
    tag: v1.5.2
    pullPolicy: IfNotPresent

  ## (optional) alertmanager URL
  ## only used if alertmanager.enabled = false
  alertmanagerURL: ""

  ## Additional Prometheus server container arguments
  ##
  extraArgs: {}

  ingress:
    ## If true, Prometheus server Ingress will be created
    ##
    enabled: false

    ## Prometheus server Ingress annotations
    ##
    annotations: {}
    #   kubernetes.io/ingress.class: nginx
    #   kubernetes.io/tls-acme: 'true'

    ## Prometheus server Ingress hostnames
    ## Must be provided if Ingress is enabled
    ##
    hosts: []
    #   - prometheus.domain.com

    ## Prometheus server Ingress TLS configuration
    ## Secrets must be manually created in the namespace
    ##
    tls: []
    #   - secretName: prometheus-server-tls
    #     hosts:
    #       - prometheus.domain.com

  ## Node labels for Prometheus server pod assignment
  ## Ref: https://kubernetes.io/docs/user-guide/node-selection/
  nodeSelector: {}

  persistentVolume:
    ## If true, Prometheus server will create/use a Persistent Volume Claim
    ## If false, use emptyDir
    ##
    enabled: true

    ## Prometheus server data Persistent Volume access modes
    ## Must match those of existing PV or dynamic provisioner
    ## Ref: http://kubernetes.io/docs/user-guide/persistent-volumes/
    ##
    accessModes:
      - ReadWriteOnce

    ## Prometheus server data Persistent Volume annotations
    ##
    annotations: {}

    ## Prometheus server data Persistent Volume existing claim name
    ## Requires server.persistentVolume.enabled: true
    ## If defined, PVC must be created manually before volume will be bound
    existingClaim: ""

    ## Prometheus server data Persistent Volume mount root path
    ##
    mountPath: /data

    ## Prometheus server data Persistent Volume size
    ##
    size: 8Gi

    ## Prometheus server data Persistent Volume Storage Class
    ## If defined, volume.beta.kubernetes.io/storage-class: <storageClass>
    ## Default: volume.alpha.kubernetes.io/storage-class: default
    ##
    storageClass: ""

    ## Subdirectory of Prometheus server data Persistent Volume to mount
    ## Useful if the volume's root directory is not empty
    ##
    subPath: ""

  ## Annotations to be added to Prometheus server pods
  ##
  podAnnotations: {}
    # iam.amazonaws.com/role: prometheus

  replicaCount: 1

  ## Prometheus server resource requests and limits
  ## Ref: http://kubernetes.io/docs/user-guide/compute-resources/
  ##
  resources: {}
    # limits:
    #   cpu: 500m
    #   memory: 512Mi
    # requests:
    #   cpu: 500m
    #   memory: 512Mi

  service:
    annotations: {}
    clusterIP: ""

    ## List of IP addresses at which the Prometheus server service is available
    ## Ref: https://kubernetes.io/docs/user-guide/services/#external-ips
    ##
    externalIPs: []

    loadBalancerIP: ""
    loadBalancerSourceRanges: []
    servicePort: 80
    type: ClusterIP

  ## Prometheus server pod termination grace period
  ##
  terminationGracePeriodSeconds: 300
What we need to change now is volume size, resource limits, ingress and set retention rate.
persistentVolume configuration will be something like this for me. As discussed in the section planning resources, the size of the volume will be 100G.
persistentVolume:
  enabled: true
  accessModes:
    - ReadWriteOnce
  annotations: {}
  existingClaim: ""
  mountPath: /data
  size: 100Gi
  storageClass: ""
  subPath: ""
resources. Since I’m going to stay with Prometheus’s default heap size (2G) I need to set max memory limit for the container to 3G
resources:
  limits:
    memory: 3Gi
  requests:
    memory: 3Gi
ingress. I’m using kube-lego for automatic management of lets encrypt certificates. So here is the settings for the assumed domain example.com. I also added an annotation to allow only the local access to it. It’s really nice way to deploy internal services. Service is internal but it has proper SSL.
ingress:
  enabled: true
  annotations:
    kubernetes.io/ingress.class: nginx
    kubernetes.io/tls-acme: 'true'
    ingress.kubernetes.io/whitelist-source-range: "192.168.1.0/24"
  hosts:
    - prometheus.example.com
  tls:
    - secretName: prometheus-server-tls
      hosts:
        - prometheus.example.com
retention rate. The last setting we’re going to set now is retention rate to 1 month. Just like a most Prometheus settings, this one should to be set as command argument. extraArgs is used to populate these arguments.
extraArgs:
  storage.local.retention: 744h
This is enough for a simple setup. Let’s deploy it.
$ helm install -f values.yaml stable/prometheus
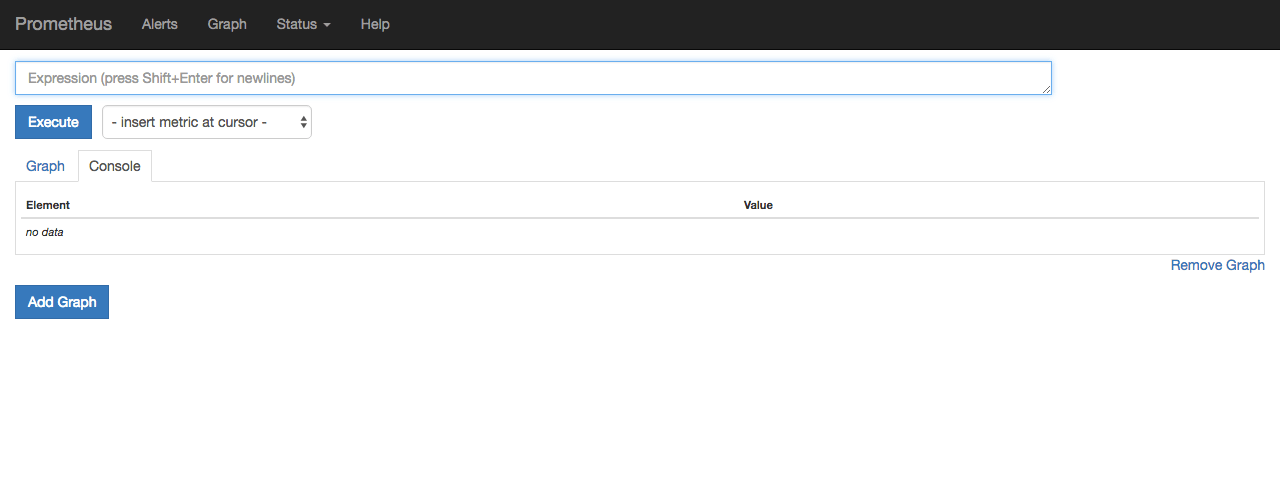
When all components are in the Running state, try to open https://prometheus.example.com. You should see the Prometheus UI.
Make sure to check that everything is green at https://prometheus.example.com/targets. It lists all services known to Prometheus.
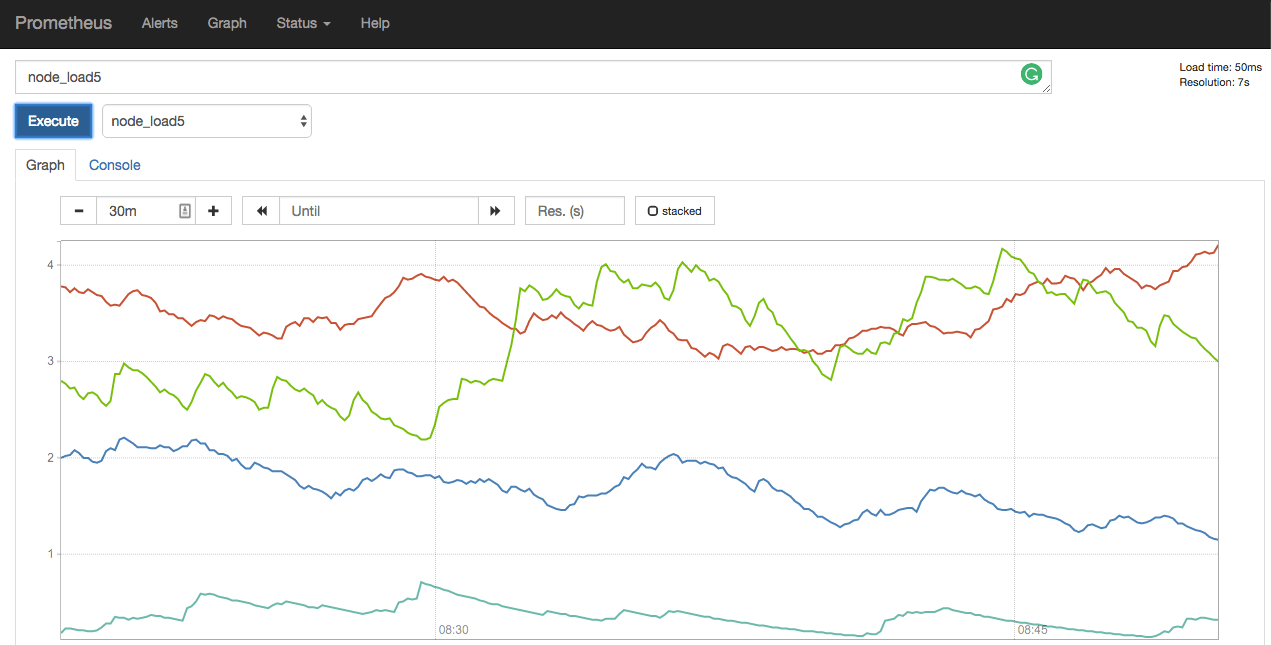
Using the UI you can explore different metrics exposed by your system. For example, you can easily inspect average node load by selecting one of the metrics - node_load1, node_load5, node_load15. Below is the example of node_load5 on my cluster.
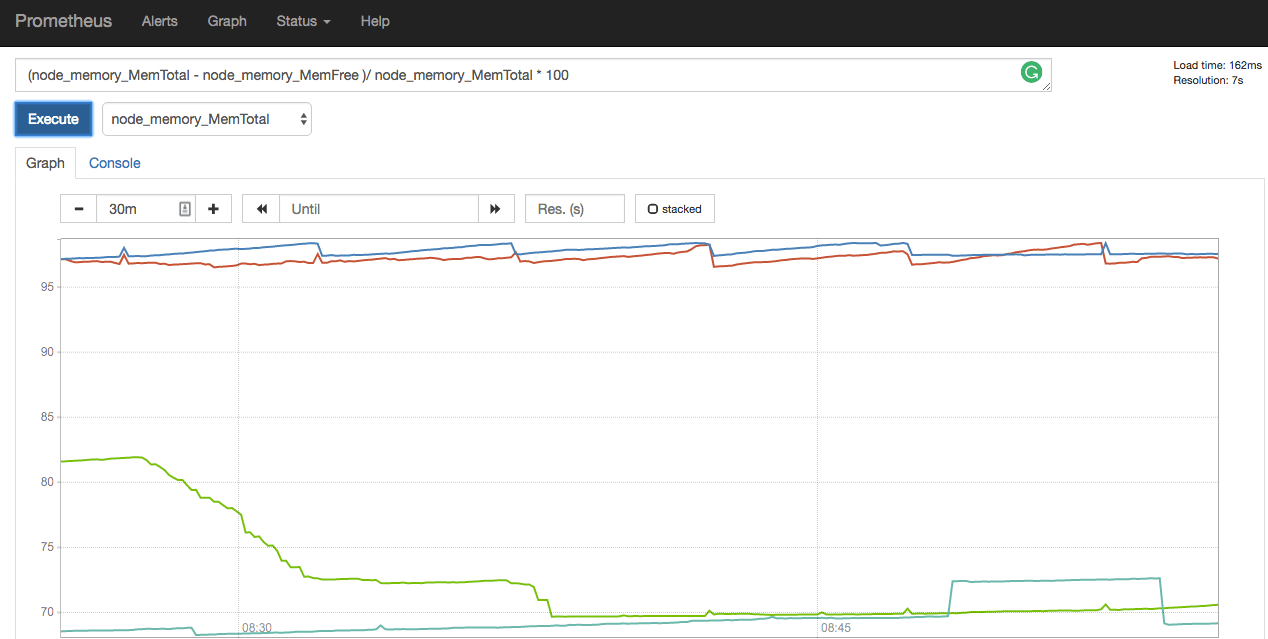
You can use most of the usual arithmetic operations, like addition or division to transform your data. A full list of operators could be found here. Here you can see memory usage in percents, constructed using 2 metrics - node_memory_MemTotal and node_memory_MemFree.
This UI is primarily useful for ad-hoc queries and debugging. For day-to-day use, we are going to deploy Grafana.
Grafana
I‘m going to install Grafana from charts also. The process in straightforward. Let’s grab default values config and update it a little.
> $ mkdir grafana && cd grafana
> $ wget https://raw.githubusercontent.com/kubernetes/charts/master/stable/grafana/values.yaml
Similar to the Prometheus setup we’re going to configure ingress. But in this case, it should be accessible to the outside world.
# update ingress to use SSL
ingress:
  enabled: true
  annotations:
    kubernetes.io/ingress.class: nginx
    kubernetes.io/tls-acme: 'true'
  hosts:
    - grafana.example.com
  tls:
    - secretName: grafana-server-tls
      hosts:
        - grafana.example.com
The chart also provides the ability to automatically install plugins. As an example, we’re going to add a few.
server:
  installPlugins: grafana-clock-panel,grafana-piechart-panel
That’s basically it. Let’s deploy.
> $ helm install -f values.yaml stable/grafana
After successful deploy, you should be able to access Grafana on https://grafana.example.com using admin: admin as credentials. You should change default login/password immediately.
IMPORTANT: Change the default login/password in grafana!!!
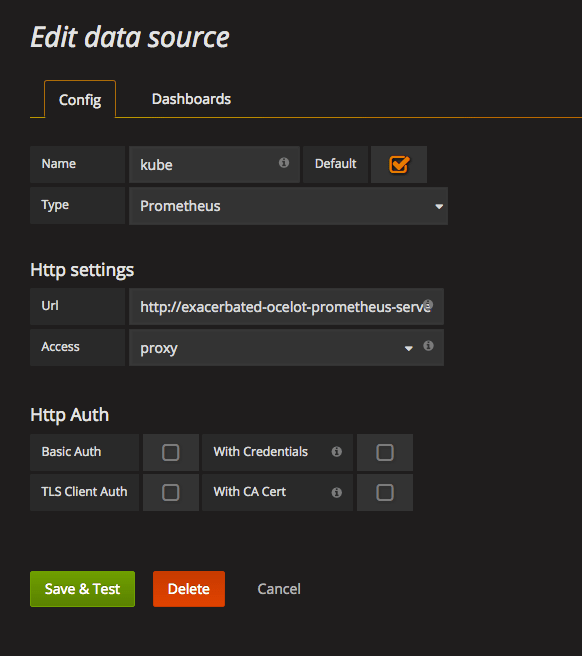
Now, we need to tell Grafana where our Prometheus lives. To do this we have to add datasource. Make sure to correctly set Url in Http settings. It should point to your internal prometheus address - http://release_name-prometheus-server.default.svc.cluster.local
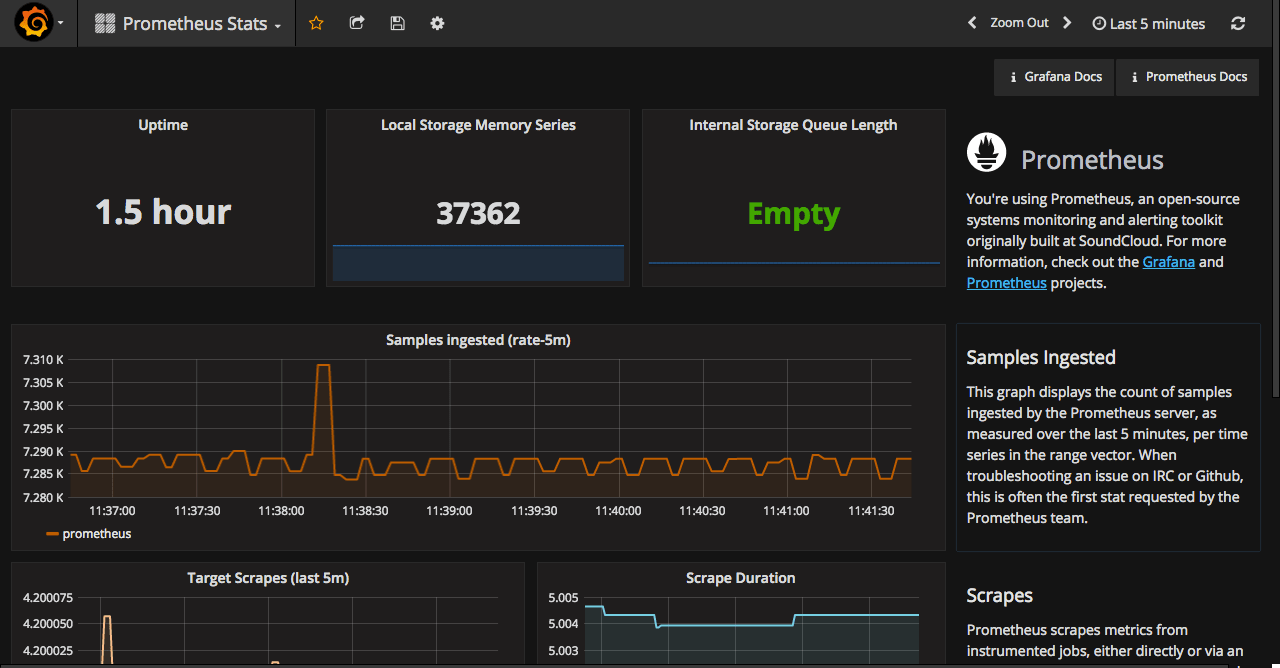
Selecting Prometheus as a type for datasource will add default Prometheus dashboard to the suggested dashboards (the second tab). Importing it will give you dashboard similar to the one shown below.
At this point, you should have a working Prometheus and Grafana. Next time I will go through a creating a node monitoring dashboard from scratch. At the end, I will post a list of the existing dashboards from grafana.net that I found useful.
Stay tuned.

Share this post
Twitter
Google+
Facebook
Reddit
LinkedIn
StumbleUpon
Email