Going open-source in monitoring, part II: Creating the first dashboard in Grafana
Series of posts about migration from commercial monitoring systems to opensource. Replace NewRelic with Prometheus

This post is one of a series of posts about monitoring of infrastructure and services. Other posts in the series:
- Intro
- Deploying Prometheus and Grafana to Kubernetes
- Creating the first dashboard in Grafana (this article)
- 10 most useful Grafana dashboards to monitor Kubernetes and services
- Configuring alerts in Prometheus and Grafana
- Collecting errors from production using Sentry
- Making sense of logs with ELK stack
- Replacing commercial APM monitoring
- SLA, SLO, SLI and other useful abstractions
Having grafana.net/dashboards with dozens of dashboards to choose from is awesome and helps get started with monitoring, but creating your own dashboards from scratch is also very helpful. When I first deployed Grafana, I imported a lot of ready dashboards, really a lot. Many of them worked out of the box, but many did not. In most cases, the fix was in change of template variables, but some required deeper involvement and understanding of how everything works. Such understanding could be acquired by creating your own dashboards.
Since one of the goals of the whole project is to replace NewRelic, the first dashboard will replicate its basic server monitoring page. In case you do not know, it looks like this.
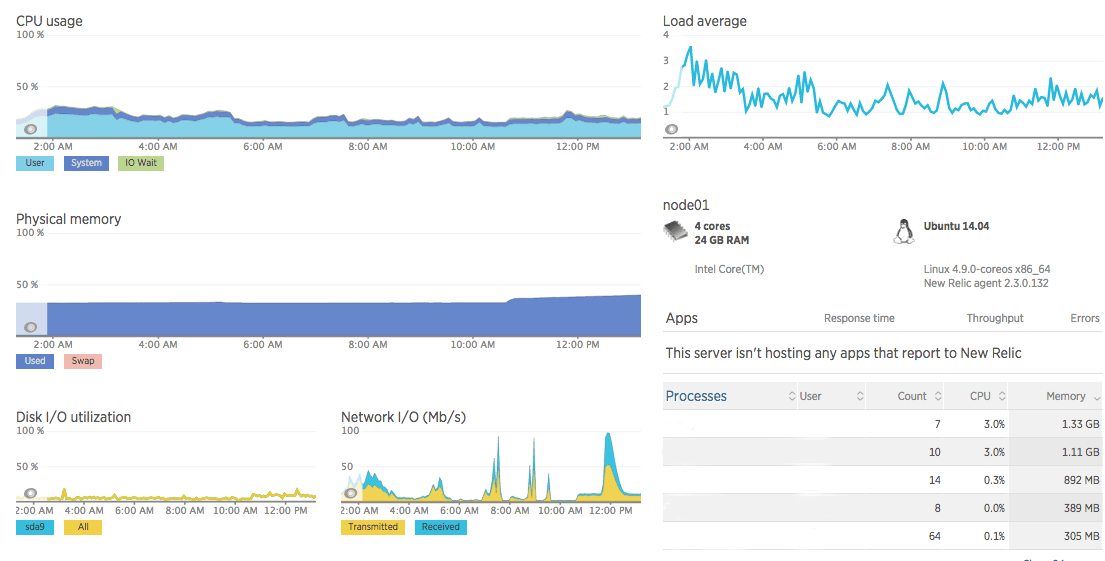
The corresponding dashboard we building is shown below.
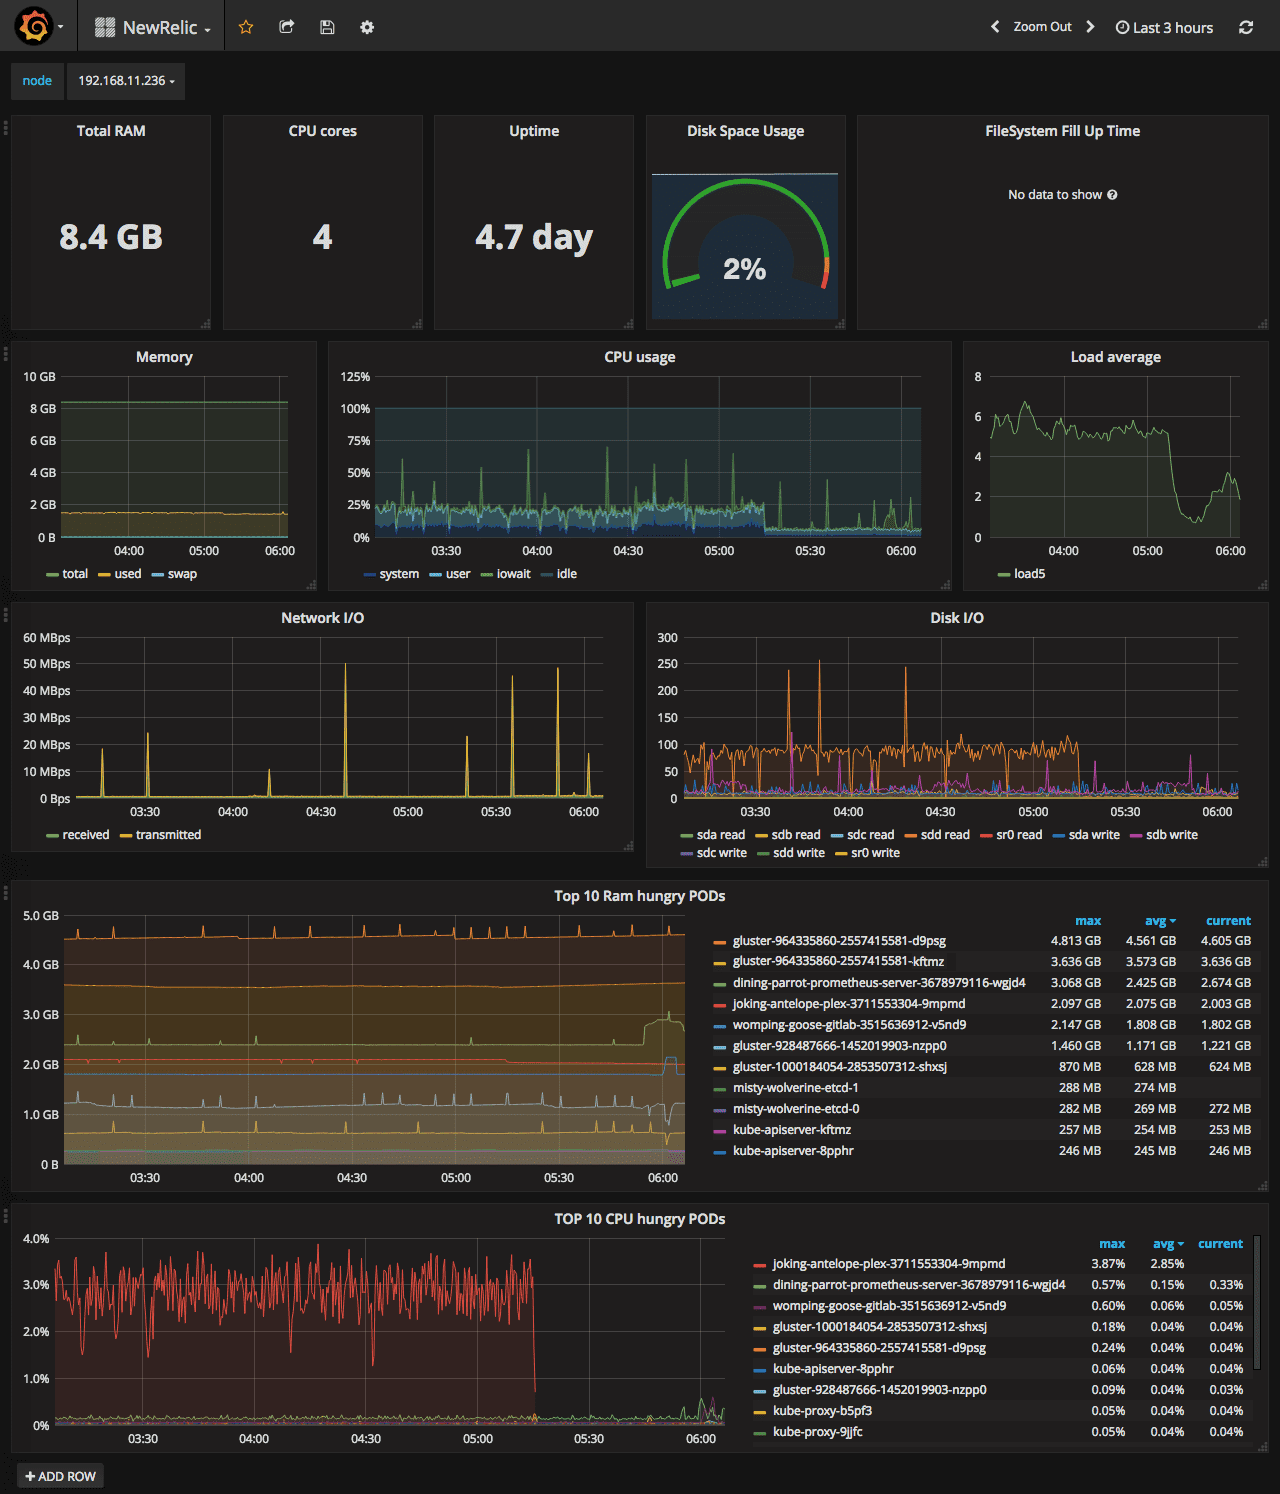
Creating server monitoring dashboard
It’s time to create the dashboard. If you just installed Grafana you’ll have “Create your first dashboard” button on the homepage. Otherwise, click “create new” from the top dropdown. I’m not going to copy the gettings-started guide from grafana docs, so if you do not know grafana basics, like how to add a graph to the dashboards - read the guide or watch the 10min beginners guide to building dashboards to get a quick intro to setting up Dashboards and Panels.
Templating
One of the essential features of Grafana is an ability to create variables. It allows you to create interactive and dynamic dashboards. You can have a single variable, like server selector, or a chain of variables each new populated based on previous selection, like namespace -> deployment -> Pod.
Templating is usually not the first thing covered in manuals. The common way is to create all graphs with hardcoded values and then replace it with the variable. I’m going to cover templating first and use variables from the beginning.
For this dashboard, we need only one variable - server selector.
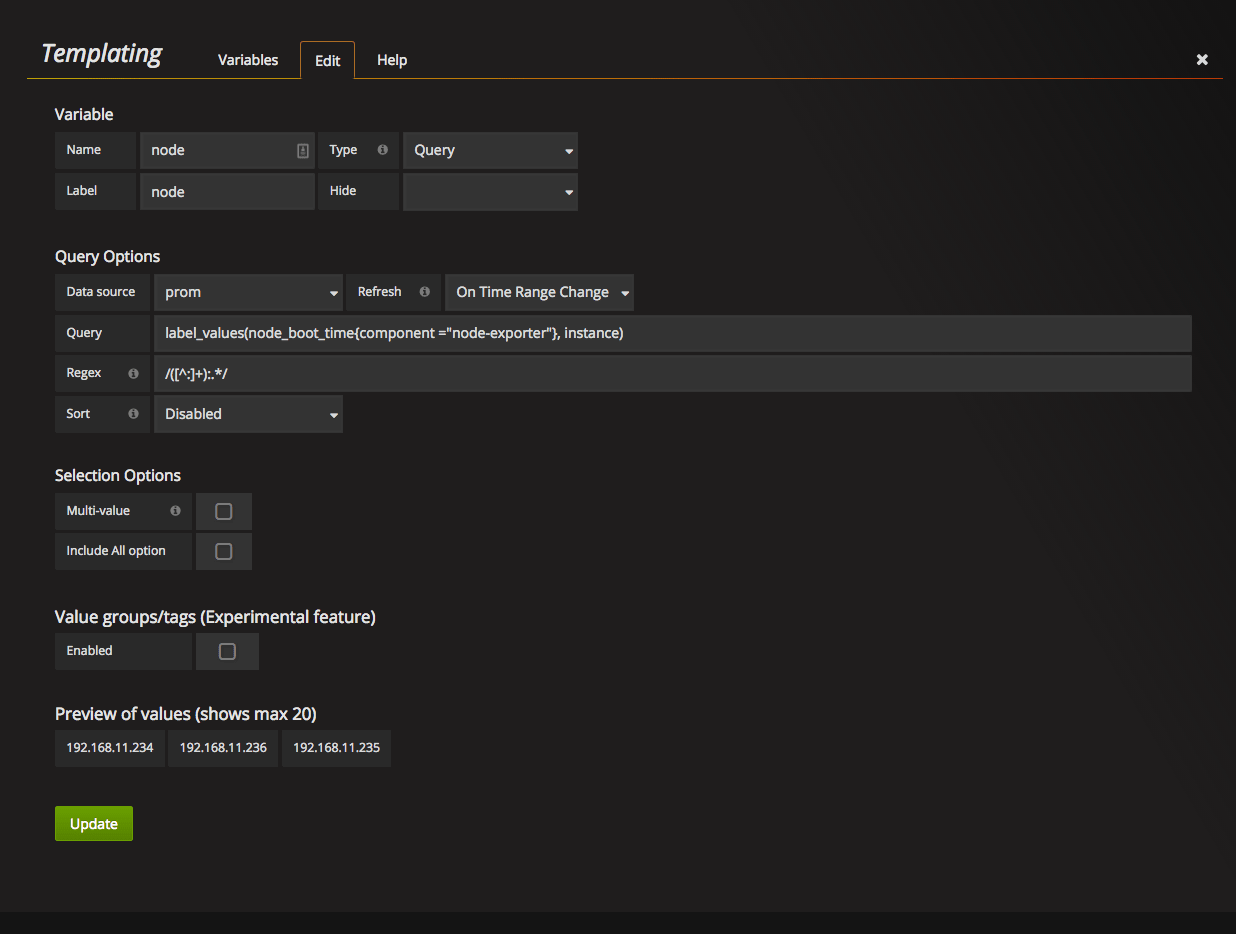
To add one go to Manage dashboards → Templating → Variables, and click +New.

You’ll get to the edit variable tab. First, set Name and Label of the new variable. I prefer to have identical label and name, it helps you not to keep the mapping between label and its name in mind.
Next, we need to set query options. This is the place where we can select data to populate dropdown.
Data source: prometheus data source you’ve created
Refresh: one of: Never / On Dashboard Load / On Time Range change. Choose what is suitable for your setup.
Query: label_values(node_boot_time{component=”node-exporter”}, instance). What does this query say. Take node_boot_time metric, filter it by label component=“node-exporter” and return a list of values of the label instance . More about queries.
Regex: Regular expression is optional, but sometimes is very helpful. For example, in my case, the result of the query is IP:PORT, but I want to show only IP in the dropdown. With regex you can make required transformations.
During edit of the query, you will see a realtime result in the bottom, under the “Preview of the values” block.
More detailed manual about templating could be found in the docs
Now, when we have our node variable, with all servers in it, we can add some graphs.
CPU usage


Let’s walk through creating of this one in details.
To build this graph we need 4 queries, all using node_cpu metric from node-exporter. Here are the queries.
system: (avg by (instance) (irate(node_cpu{instance=~"$node:.*",mode=~"system|irq|softirq"}[5m])) * 100)
user: (avg by (instance) (irate(node_cpu{instance=~"$node:.*",mode="user"}[5m])) * 100)
iowait: (avg by (instance) (irate(node_cpu{instance=~"$node:.*",mode="iowait"}[5m])) * 100)
idle: (avg by (instance) (irate(node_cpu{instance=~"$node:.*",mode="idle"}[5m])) * 100)
All these queries differ only by the mode filter, so let’s look only at the first one - system. What is happening here: node_cpu metric is filtered by instance using our previous template variable and by mode. Since it is counters we need to use irate(rate) function to calculate the per-second rate. This will produce the list of results, one for each CPU/core on the machine, so we need to aggregate it to get a single per-node value. At the end, we need to multiply it by 100 to get percents of the total load.
Here is a good article about the rate vs irate difference and this one is about CPU usage calculation.
SystemLoad
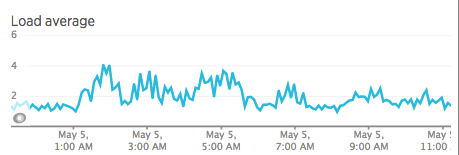

load5: node_load5{instance=~"$node:.*"}
Memory


total: node_memory_MemTotal{instance=~"$node:.*"}
used: node_memory_MemTotal{instance=~"$node:.*"} - node_memory_MemFree{instance=~"$node:.*"} - node_memory_Cached{instance=~"$node:.*"} - node_memory_Buffers{instance=~"$node:.*"} - node_memory_Slab{instance=~"$node:.*"}
swap: (node_memory_SwapTotal{instance=~"$node:.*"} - node_memory_SwapFree{instance=~"$node:.*"})
Network I/O
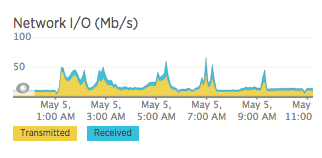

received: sum(irate(node_network_receive_bytes{instance=~"$node.*"}[5m]))
transmitted: sum(irate(node_network_transmit_bytes{instance=~"$node.*"}[5m]))
Disk I/O
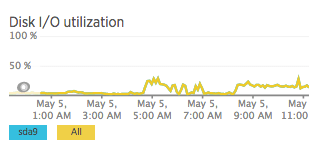

read_by_device: irate(node_disk_reads_completed{instance=~"$node:.*", device!~"dm-.*"}[5m])
write_by_device: irate(node_disk_writes_completed{instance=~"$node:.*", device!~"dm-.*"}[5m])
Top 10 memory hungry pods

For this graph, we’re going to use two new functions - sort_desc and topk.
topk is used to limit results, while sort_desc is to sort it.
by (pod_name) - will group results by pod_name
metrics: sort_desc(topk(10, sum(container_memory_usage_bytes{pod_name!=""}) by (pod_name)))
Top 10 CPU hungry pods

metrics: sort_desc(topk(10, sum by (pod_name)( rate(container_cpu_usage_seconds_total{pod_name!=""}[1m] ) )))
Node overview

This row is a bit different from all the others. While all previous stats were using Graph type, here we’re going to use Singlestats **and Table.
Total RAM:
type: singlestat
metrics: node_memory_MemTotal{instance=~"$node:.*"}
options: stat=current, unit=bytes, decimals=1
CPU cores:
type: singlestat
metrics: count(count(node_cpu{instance=~"$node:.*"}) by (cpu))
Uptime:
type: singlestat
metrics: node_time{instance=~"$node:.*"} - node_boot_time{instance=~"$node:.*"}
options: stat=current, unit=seconds, decimals=1
Disk Space Usage:
type: singlestat
metrics: sum((node_filesystem_size{instance=~"$node:.*",mountpoint="/rootfs"} - node_filesystem_free{instance=~"$node:.*",mountpoint="/rootfs"}) / node_filesystem_size{instance=~"$node:.*",mountpoint="/rootfs"}) * 100
FileSystem Fill Up Time

This one is a bit more sophisticated. It uses simple linear regression to predict time until disks fill up.
We’re using avg by (device) to show each device only once, otherwise, we will have one line for each mountpoint.
type: table
metrics: avg by (device) (deriv(node_filesystem_free{device=~"/dev/sd.*",instance=~"$node:.*"}[4h]) > 0)
In case you only have 3 mountpoints (/etc/hosts, /etc/hostsname, /etc/resolv.conf) exposed by node-exporter - double check that your node-exporter pods have all the rootfs directories mounted. As stated here.
Wrap up
That’s it. Now we have a node overview dashboard which shows all the basic information available in NewRelic server view. As a bonus, we’ve got disk fullness prediction and information about most RAM/CPU hungry pods. Source of this dashboard is available on GitHub.
Stay tuned.

Share this post
Twitter
Google+
Facebook
Reddit
LinkedIn
StumbleUpon
Email