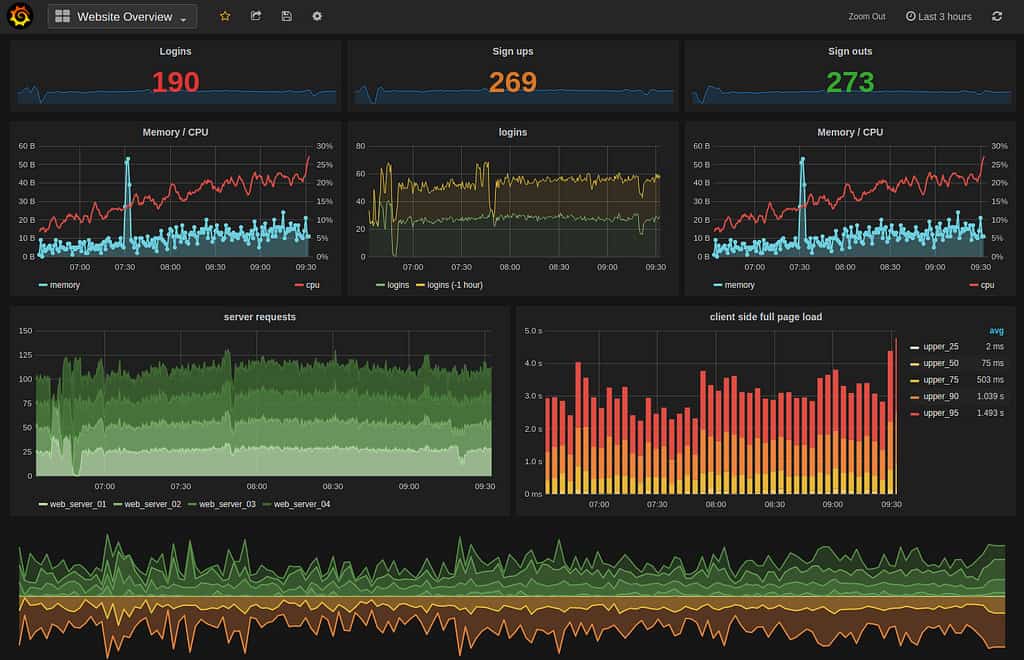
Going open-source in monitoring, part 0: Intro
Series of posts about migration from commercial monitoring systems to opensource.

- Intro (this article)
- Deploy and basic configuration of Prometheus
- Creating the first dashboard in Grafana
- 10 most useful Grafana dashboards to monitor Kubernetes and services
- Configuring alerts in Prometheus and Grafana
- Collecting errors from production using Sentry
- Making sense of logs with ELK stack
- Replacing commercial APM monitoring
- SLA, SLO, SLI and other useful abstractions
Monitoring of the infrastructure is an essential part of any product. But it’s not uncommon for companies to postpone monitoring for the later period. Having it in “nice-to-have” bucket. That’s one of the reasons why they spend a lot of time reacting to the problems after service disruption. The uptime of the infrastructure is as important to the product as the product itself. Monitoring is especially crucial in modern cloud based systems. Containers and even nodes could die any minute, and you will not be able to analyze logs afterwords. Monitoring as a base for any service is perfectly described in a Dickerson’s Hierarchy of Reliability.

Monitoring is hard. But collecting the metrics is only a part of the problem, not the hardest though. Interpreting the data and using monitoring systems is much more difficult. It does not matter if you collect all possible metrics if you do not have proper dashboards and alert systems.
For a long time, I was using systems like NewRelic for monitoring my infrastructures and applications. One of the main reasons for it was ease of install and ready to use dashboards.
Recently, I decided to stop using commercial monitoring systems in favor of the open-source. It’s not the first attempt, though. Previously I already tried to use Prometheus and ELK stack (ElasticSearch, Logstash, Kibana). But, I never actually did a full switch. Even having the system in place I did not use it very often. So, sooner or later, the disk space or other resources were needed, and since there was NewRelic, these systems were deleted.
The main reason for the failures, I believe, was the default place to go. You can’t have several systems doing almost the same. One will always be the monitoring system. One that you will open when something is wrong. In my case it was NewRelic.
Another reason is not enough time spent configuring. Since you’re trying to replace an existing system, which works, you’re not committed. You will always have an excuse like “it didn’t work for me”, or “I didn’t have enough time to configure it”.
This time I decided to stop using NewRelic, and make Grafana my default place to go.
In this series of posts, I’m planning to describe my migration path. The end goal is to have complete monitoring of the Kubernetes based infrastructure. Having alert system in place. Configure and visualize logs from the infrastructure and applications.
And the final and the hardest step is to replace APM.
Stay tuned.

Share this post
Twitter
Google+
Facebook
Reddit
LinkedIn
StumbleUpon
Email